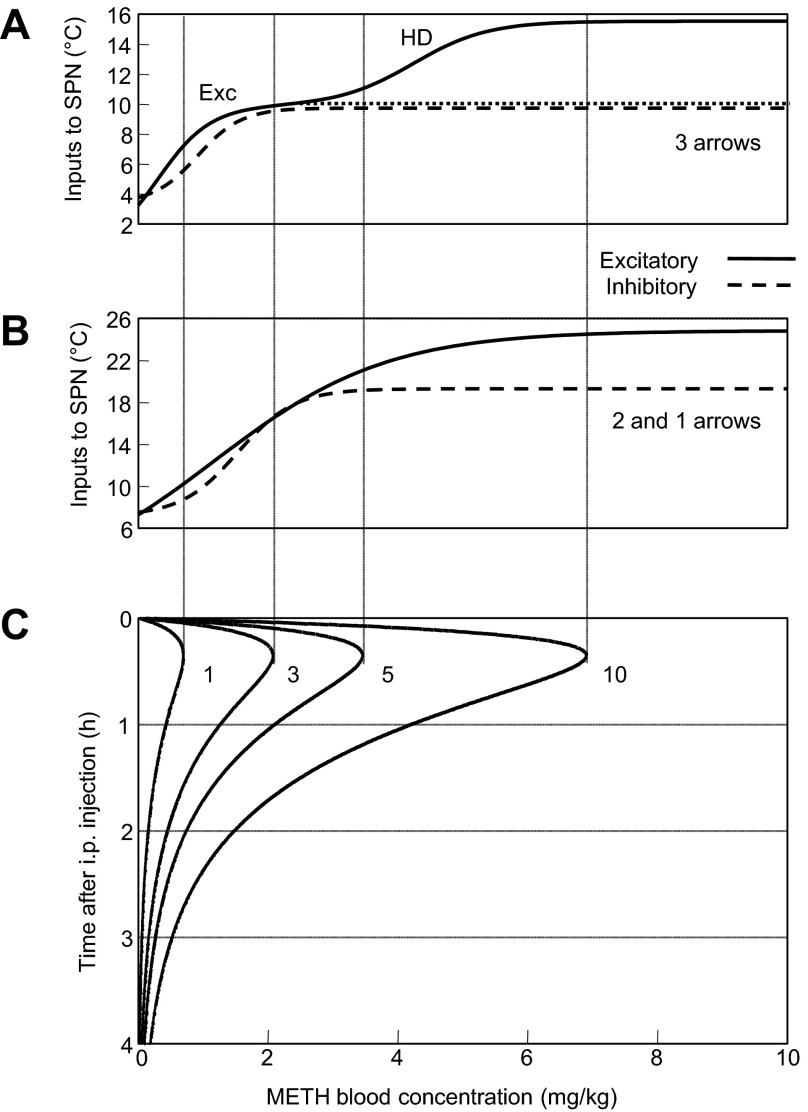
Fig. 4.
A and B: excitatory and inhibitory components of thermogenic activity in three- and two-arrow models as a function of Meth concentration in the blood. C: reconstructed time courses of Meth concentration in the blood for 1, 3, 5, and 10 mg/kg Meth. Vertical lines show maximal Meth concentrations in the blood for each dose in A and B.

