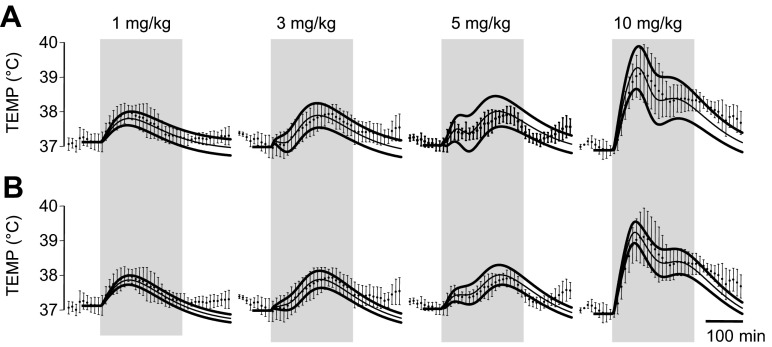
Fig. 7.
Variability of temperature responses to 1, 3, 5, and 10 mg/kg Meth due to model parameter perturbation. A: two-arrow model. B: three-arrow model. ● with error bars represent average and SD of experimentally measured core body temperature. Top and bottom solid lines are maximal and minimal temperature responses produced by the models after 3% change in key model parameters.

