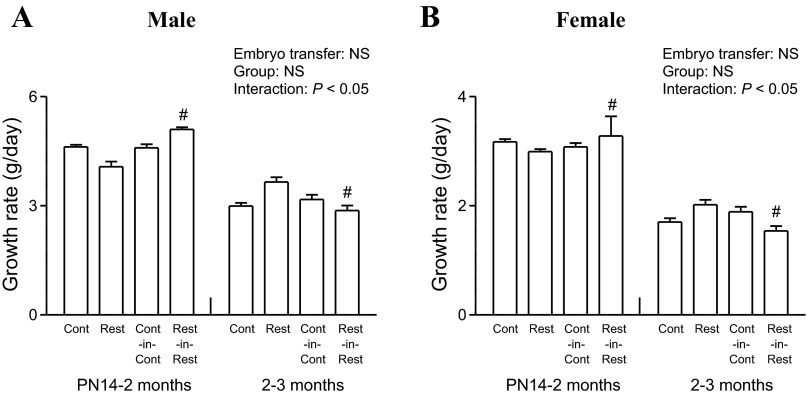
Fig. 2.
Effect of embryo transfer and maternal birth weight on F2 growth rates. Growth rates measured between PN14–2 mo and 2–3 mo (A and B) in F2 male and female offspring. All data are expressed as means ± SE; 1 male and 1 female randomly selected per litter, n = 7–17 per group. Two-way ANOVA was performed to determine main effects of embryo transfer (non-embryo-transferred and embryo-transferred) and group (Control and Restricted). Growth rates at PN14–2 mo and 2–3 mo were analyzed separately and plotted on the same graph within each sex. #P < 0.05 vs. non-embryo-transferred counterpart (Student's unpaired t-test following observations of significant interaction). PN, postnatal day; NS, not significant.

