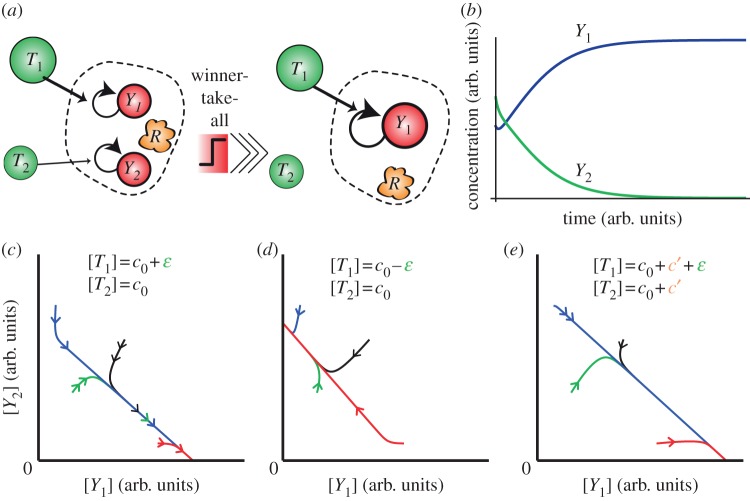
Figure 1.
WTA in enzymatic systems. (a) Several outputs Yj replicate, thanks to a specific template Tj and a common and limited enzymatic resource R. They are continuously degraded by a mechanism not shown here. The competition for the resource R leads a WTA effect. The output with the highest concentration of template evicts the others because it provides the fastest replication rate for its output (assuming all other chemical parameters are equal). (b) Schematic time-plot showing the WTA effect. Although there is initially more Y2 than Y1, the latter eventually evicts the former as [T1] > [T2]. (c) Phase plot in the space of concentrations for several trajectories with different initial conditions. The template T1 is in slight excess compared with T2. The winner, Y1, does not depend on the initial concentration of outputs, provided they are all initially present. (d) The output Y2 wins for the same initial conditions as (c), but with an excess of T2 over T1. (e) The behaviour is unchanged by a shift of all templates concentrations by a constant concentration c′.

