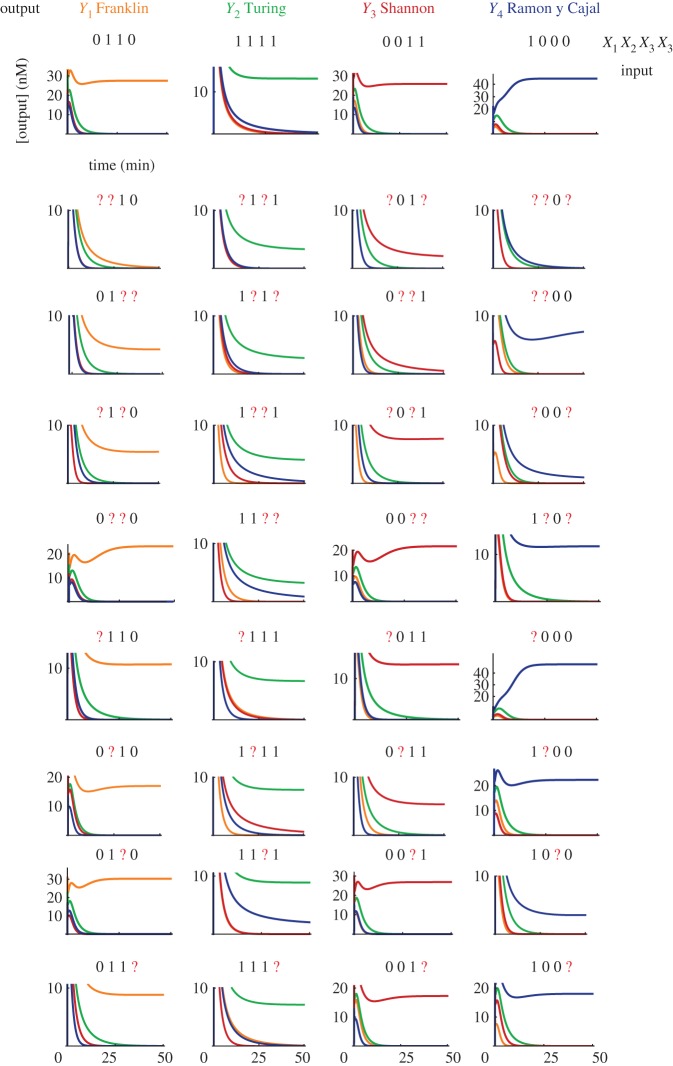
Figure 6.
Visual DSD simulations of pattern classification with a DNA-only circuit (deterministic simulations, default compilation, no leak). The plots show the temporal response for free outputs Yj to the same patterns as figure 4. We use the concentration for the weights complexes given by the matrix in equation (1.5). [Fuel](0) = [Amplifying gate](0) = 1700 nM, [Threshold gates](0) = 680 nM. For the input concentration, we use c0 = 250 nM. The inputs are injected at t = 0.

