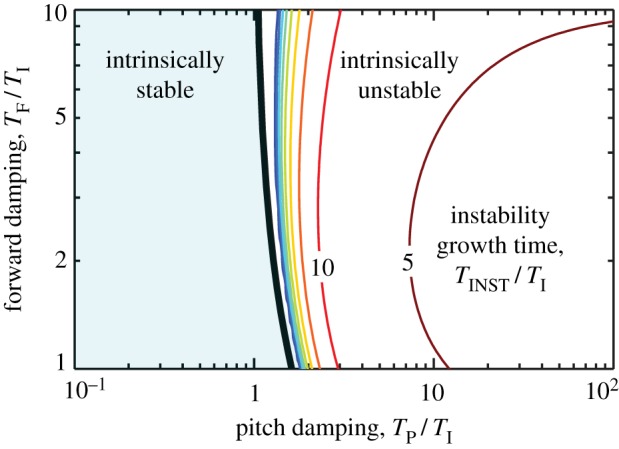
Figure 4.

Stability diagram for insect flight. Stability characteristics are plotted as a function of dimensionless forward and pitch damping time scales, TF/TI and TP/TI. The light blue region to the left of the black line corresponds to intrinsic stability. The region to the right is unstable, and the contours show the dimensionless instability growth time, TINST/TI. (Online version in colour.)
