Abstract
Current analyses on insect dynamic flight stability are based on linear theory and limited to small disturbance motions. However, insects' aerial environment is filled with swirling eddies and wind gusts, and large disturbances are common. Here, we numerically solve the equations of motion coupled with the Navier–Stokes equations to simulate the large disturbance motions and analyse the nonlinear flight dynamics of hovering model insects. We consider two representative model insects, a model hawkmoth (large size, low wingbeat frequency) and a model dronefly (small size, high wingbeat frequency). For small and large initial disturbances, the disturbance motion grows with time, and the insects tumble and never return to the equilibrium state; the hovering flight is inherently (passively) unstable. The instability is caused by a pitch moment produced by forward/backward motion and/or a roll moment produced by side motion of the insect.
Keywords: insect, flight dynamics, nonlinear stability, equations of motion, the Navier–Stokes equations
1. Introduction
Insect flight dynamics and dynamic flight stability are of great interest to researchers who study the biomechanics of insect flight and to engineers who try to make insect-like micro aerial vehicles.
In recent years, much work has been carried out in this area [1–9], using an averaged model and the linear theory borrowed directly from the literature of aircraft flight dynamics. In the averaged model, it is assumed that the wings beat fast, so that the rigid-body modes of the central body are not excited, and the insect can be treated as a rigid body of 6 degrees of freedom (the effects of the flapping wings on the body being represented by the wingbeat-cycle-average forces and moments that can vary with time over the timescale of the central body). With the averaged model, the standard aircraft equations of motion [10] can be used for flying insects. Recent numerical [11,12] and theoretical [3,13] studies have shown that the averaged model works very well for insects who have relatively high wingbeat frequency and small wing-mass to body-mass ratio (hence very small amplitude of body oscillation); for insects who have relatively low wingbeat frequency and large wing-mass to body-mass ratio (hence relatively large amplitude of body oscillation), the averaged model works less well, nevertheless, it can still correctly predict the trend of variation of the dynamic properties. The linear theory assumes that the animal's motion consists of small disturbances from the equilibrium flight; thus, the equations of motion are linearized about the equilibrium point, and the aerodynamic forces and moments are represented as analytical functions of the motion variables (state variables) and the aerodynamic derivatives [10]. The resulting system of linear ordinary differential equations can be solved by the techniques of eigenvalue and eigenvector analysis [10].
Using this framework, Taylor & Thomas [1] studied forward flight dynamic stability in desert locusts, providing the first formal quantitative analysis of dynamic stability in a flying animal. They obtained the aerodynamic derivatives by measuring the aerodynamic forces and moments of tethered locusts in wind tunnel at various wind speeds and body attitudes. Sun & Xiong [2] studied the flight stability of a bumble-bee at hovering. They obtained the aerodynamic derivatives using the method of computational fluid dynamics (CFD; the computational approach allows simulation of the inherent stability of a flapping motion in the absence of active control, which is difficult to achieve in experiments using real insects). Sun et al. [3,4] further studied the hovering stability in several insects with various sizes and wingbeat frequencies (hoverfly, dronefly, cranefly and hawkmoth). Faruque & Humbert [5,6] and Cheng & Deng [7] studied the stability in several hovering model insects (fruitfly, stalk-eyed fly, bumble-bee and hawkmoth). They estimated the aerodynamic derivatives using the blade-element theory and the slopes of experimental lift and drag curves of a sweeping model fruitfly wing. Schenato et al. [8] and Deng et al. [9] developed stabilization control algorithms for flapping flight of robotic insects.
Because of the linearization, the above-mentioned analyses are limited to small disturbance motions. The aerial environment of flying insects is filled with swirling eddies, sharp velocity gradients and wind gusts, and large disturbances are common [14]. Therefore, it is important to study the nonlinear flight dynamics and stability of insects in large disturbance motions. Taylor & Zbikowski [15] made an attempt to take the nonlinearities into account. They used the nonlinear equations of motion; however, the aerodynamic forces and moments were represented by linearized time-periodical functions based on measurements from tethered locusts. Liu et al. [16] made a similar attempt; they also used the nonlinear equations of motion with the aerodynamic force and moment terms represented by linearized time-periodical functions (their aerodynamic forces and moments were computed by a CFD method). Because aerodynamic forces and moments are linearized, these studies [15,16] are also limited to small disturbance motions. One way to study the nonlinear, large disturbance motions is to solve the complete equations of motion and flow equations.
In this study, we numerically solve the complete equations of motion coupled with the Navier–Stokes equations to simulate the large disturbance motions and analyse the nonlinear flight dynamics and stability of hovering model insects. We consider two representative model insects: a model hawkmoth and a model dronefly. The former may represent insects with relatively large size and low wingbeat frequency (mass, 1578.6 mg; frequency, 26 Hz); the latter may represent insects with relatively small size and high wingbeat frequency (mass, 88.9 mg; frequency, 164 Hz). First, we obtain the solution of the equilibrium flight; then, we give various disturbances to the equilibrium solution and study the stability of the equilibrium flight.
2. Material and methods
2.1. Governing equations and the solution method
2.1.1. Equations of motion
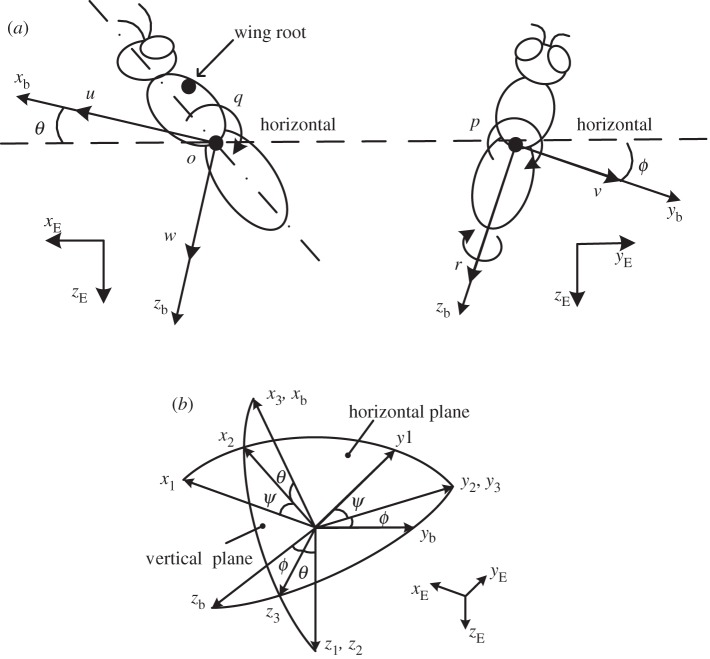
Let frame (xE, yE, zE) be an earth-fixed, inertial frame; the xE and yE axes are horizontal and, the zE axis is vertical, pointing downward (figure 1a). Let (xb, yb, zb) be a frame fixed on the insect body with its origin at the centre of mass of the wingless body; xb and zb are in the longitudinal symmetrical plane of the body and yb points to the right side of the insect (figure 1a). The orientation of the insect's body or the (xb, yb, zb) frame is given by the three Euler angles [10] of the body, denoted by ψ, θ, ϕ (figure 1b); in this study, they are called as yaw, pitch and roll angles, respectively. The equations of motion of a flying insect are (see the electronic supplemental material for the derivation of the equations):
| 2.1a |
| 2.1b |
| 2.1c |
 |
2.1d |
 |
2.1e |
 |
2.1f |
| 2.1g |
and
| 2.1h |
where u, v and w denote the xb, yb and zb components of the velocity of the insect body, respectively, and p, q and r denote the xb, yb and zb components of the angular velocity of the body, respectively; m is the total mass of the insect (body mass plus wing mass); Ix,bw, Iy,bw, Iz,bw, Ixy,bw, Iyz,bw and Izx,bw are the moments and products of inertial of the body and wings; XA, YA and ZA denote the xb, yb and zb components of the total aerodynamic force, respectively, and LA, MA and NA denote the xb, yb and zb components of the total aerodynamic moment about the centre of mass of the body, respectively; XI, YI and ZI denote the xb, yb and zb components of the inertial force owing to the flapping wings, respectively, and LI, MI and NI denote the xb, yb and zb components of the moment produced by the inertial forces of the flapping wings, respectively; MXG, MYG and MZG denote the xb, yb and zb components of the moment about the centre of mass of the body produced by the weight of the wings.
Figure 1.
(a) Definition of the state variables and sketches of the reference frames. (b) The orientation of the insect is given by a series of three consecutive rotations, the Euler angles [10].
u, v, w, p, q, r, θ and ϕ, which determine the motion of the flying system, are called state variables (the yaw angle ψ is not independent and is determined by q, r, θ and ϕ; see the electronic supplementary material).
2.1.2. The Navier–Stokes equations
The Navier–Stokes equations, which determine the aerodynamic forces and moments in equation (2.1), are
| 2.2a |
and
| 2.2b |
where u is the fluid velocity, p is the pressure, ρ is the density, v is the kinematical viscosity,  is the gradient operator and
  is the Laplacian operator.
Equation (2.2) is numerically solved over moving overset grids, because there is relative motion between the left and right wings. The solution method is the same as that used by Sun et al. in several previous studies [17–19] and, a description of it is given in the electronic supplementary material (the computational grids and grid resolution tests are also given there).
2.1.3. Integration method of coupling equations of motion with the Navier–Stokes equations
The equations of motion (equation (2.1)) and the Navier–Stokes equations (equation (2.2)) must be coupled in the solution process, because the aerodynamic forces and moments in the equations of motion must be obtained from the solution of the Navier–Stokes equations, and the boundary condition of Navier–Stokes equations must be obtained from the insect's motion governed by the equations of motion. The integration process is as follows. Suppose that at time tn the motion of the insect body (u, v w, p, q, r, ψ, θ and ϕ) are known (the wing motion with respect to the body is prescribed); hence, the boundary conditions of the Navier–Stokes equations are known, and also suppose that the flow before tn is known. Then, the Navier–Stokes equations are solved to provide the aerodynamic forces and moments at tn. Next, equation (2.1) is marched to the next time station tn + 1, using the Euler predictor–corrector method (which has second-order time accuracy). The process is repeated in the next step, and so on (see the electronic supplementary material for a more detailed description of the integration method).
2.2. Wings, flapping motion and flight data
The platforms of the model wings of the dronefly and the hawkmoth were obtained from the measured data of Liu & Sun [20] and Ellington [21], respectively, and the wing section was a flat plate of 3 per cent thickness with rounded leading and trailing edges. The model wings were assumed to be rigid.
On the basis of experimental data [20,22–24], the flapping motion of a wing was assumed as follows. The motion consisted of two parts: the translation (azimuthal rotation) and the rotation (flip rotation; the out-of-plane motion of the wing (deviation) is neglected). The time variation of the positional angle (ϕ) of the wing was approximated by the simple harmonic function:
| 2.3 |
where n is the wingbeat frequency,  is the mean stroke angle and Φ is the stroke amplitude. The angle of attack of the wing (α) took a constant value during the down- or upstroke translation (the constant value was denoted by αd for the downstroke translation and αu for the upstroke translation); around stroke reversal, the wing flipped, and α changed with time according to the simple harmonic function. The function representing the time variation of α during the supination at mth cycle was
 |
2.4 |
where Δtr is the time duration of wing rotation during the stroke reversal, and a is a constant:
| 2.5a |
where t1 is the time when the wing-rotation started:
| 2.5b |
where T is the wingbeat cycle. The expression of the pronation could be written in the same way. From equations (2.3)–(2.5), we see that to prescribe the flapping motion, Φ, n, Δtr, αd, αu and  must be given.
Morphological and wing motion parameters for the dronefly were taken from the data by Liu & Sun [20] and those for the hawkmoth from the data by Willmott & Ellington [23,24]. It should be noted that moments and products of inertia of wing and roll and yaw moments and products of inertia of body were not given in these references. Moments and products of inertia of wing were estimated using the data on density distribution of a dronefly wing [25]. Roll and yaw moments and products of inertia of body were estimated using pictures showing the lateral and dorsal–ventral views of the wingless body [4], assuming constant density.
Morphological data for the bodies are listed in table 1, and those for the wings are listed in table 2. Wing and body kinematical data are listed in table 3. From table 3, we see that all needed wing-kinematical parameters are given, except αd, αu and  . These three parameters are determined in the process of obtaining the periodical solution of hovering. The reasons for not using experimental data for the three parameters are as follows. There are necessarily small errors in the measurement. When there are small errors in the wing kinematical parameters, a periodic solution not representing a hover flight, but a flight with some small speed is obtained [25]; for example, if the measured angle of attack is a little larger than the real one, then the computed periodic solution gives an upward flight of small speed. To overcome this problem, we do not use experimental data to prescribe αd, αu and
  , but determine them in the solution process, by requiring that they take values such that hovering flight is ensured. The reason for only three parameters being determined in this way is that there are three conditions to be met in hovering flight: zero mean horizontal velocity, zero mean vertical velocity and zero mean pitch rate. The reason for choosing αd, αu and
  to be determined in the solution process is that experimental data for αd and αu have relatively large error [20] and aerodynamic forces, and moments are very sensitive to the variations in αd, αu and
  .
.
Table 1.
Morphological data of body (DF, model dronefly; HM, model hawkmoth). mbd, mass of body; Ix,b, Iy,b, Iz,b, Ixy,b and Iyz,b, moments and products of inertia of body; lb, body length; l1, distance between the wing-base axis and the centre of mass of the body; χ0, free body angle (with χ0 and l1 known, the relative position of the wing-base axis and the centre of mass of the body can be determined).
| ID | mbd (mg) | lb (mg) | l1/lb |
 (°) (°) |
Ix,b (kg m2) | Iy,b (kg m2) | Iz,b (kg m2) | Ixz,b (kg m2) |
|---|---|---|---|---|---|---|---|---|
| HM | 1485 | 42.49 | 0.26 | 82.9 | 1.01 × 10⁻⁷ | 1.42 × 10⁻⁷ | 5.24 × 10⁻⁸ | −5.96 × 10⁻⁸ |
| DF | 87.76 | 14.11 | 0.13 | 52 | 5.60 × 10⁻¹⁰ | 1.18 × 10⁻⁹ | 7.17 × 10⁻¹⁰ | −5.00 × 10⁻¹⁰ |
Table 2.
Morphological data of wing (DF, model dronefly; HM, model hawkmoth). mwg, mass of one wing; R, wing length; c, mean chord length of wing; S, area of one wing; r2, radius of second moment of wing area; Ix,w, Iy,w and Iz,w, moments of inertia of wing about xw, yw and zw axes, respectively; Ixy,w, product of inertia of wing.
| ID | mwg (mg) | R (mm) | c (mm) | S (mm2) | r2/R | Ix,w (kg m2) | Iy,w (kg m2) | Iz,w (kg m2) | Ixz,w (kg m2) |
|---|---|---|---|---|---|---|---|---|---|
| HM | 46.82 | 48.5 | 18.37 | 890.9 | 0.51 | 1.59 × 10⁻⁹ | 1.94 × 10⁻⁸ | 1.78 × 10⁻⁸ | 3.86 × 10⁻¹⁰ |
| DF | 0.56 | 11.2 | 2.98 | 33.34 | 0.55 | 5.23 × 10⁻¹³ | 1.25 × 10⁻¹¹ | 1.20 × 10⁻¹¹ | 8.04 × 10⁻¹³ |
Table 3.
Kinematic data of wing and body (DF, model dronefly; HM, model hawkmoth). Φ, n, Δtr, stroke plane angle β, mean body angle χ, Reynolds number of wing Re (Re = cU/ν, where ν is the kinematical viscosity of the air and U the mean flapping velocity, U = 2Φnr2).
| ID | Φ (°) | n (Hz) | Δtr (T) | β (°) | χ (°) | Re |
|---|---|---|---|---|---|---|
| HM | 114.4 | 26.1 | 0.3 | 0 | 54.8 | 3315 |
| DF | 107.1 | 164 | 0.3 | 0 | 42 | 782 |
2.3. The equilibrium flight
To study the stability of hover flight, we need to first obtain the solution to equations (2.1) and (2.2) that represents the equilibrium flight. Because of the periodically varying aerodynamic and inertial forces of the flapping wings, a hovering or constant-speed flying insect is a cyclically forcing system, and generally, the flight is in a cyclic-motion equilibrium. The equilibrium flight, here hovering, is represented by a periodical solution of equations (2.1) and (2.2). A method of obtaining the periodic solution of hover flight has been developed by Wu et al. [25]. A brief description of the method and the solution process is given in the electronic supplementary material.
2.4. Solution of the disturbance motion and flight stability
With the periodic solution of the equilibrium flight known, its stability is investigated by giving the equilibrium solution a perturbation at initial time and then marching equation (2.1) and (2.2) in time.
Let the periodic solution be given between t = −T and t = 0 (where T is the wingbeat period or the period of the periodic solution). If we simply add initial disturbances to the periodical solution at t = 0, then there would be an abrupt change in flow field, which could make the flow solution difficult to converge. We avoid this problem by adding the initial disturbances in a finite but short time interval: from t = −0.1T to t = 0; in this short interval, initial disturbances quickly but smoothly change from zero to the desired values. Then, we continue to solve equation (2.1) and (2.2) to see whether the disturbance motion will die out or not.
As defined earlier, u, v and w are the xb, yb and zb components of the velocity of the body centre of mass, respectively. In hover flight, the xb axis is approximately horizontal and zb axis approximately vertical, and u and w can approximate the horizontal and vertical velocities, respectively, of the insect. In disturbance motions, the body, hence the xb, yb and zb axes, may rotate by large angles, and u and w can no longer approximate the horizontal and vertical velocities of the insect. In the following, we use uE and vE to denote the forward (or backward) and lateral horizontal velocities, respectively, and wE to denote the vertical velocity (they are the xE, yE and zE components of the velocity of the body centre of mass, respectively). uE, vE and wE are related to u, v and w as follows:
| 2.6a |
| 2.6b |
and
| 2.6c |
3. Results
When presenting the results, non-dimensional quantities are used. In the non-dimensionalization, U, c and c/U are taken as reference velocity, length and time, respectively (here, U is the mean flapping velocity, defined as  and c is the mean chord length of wing).
First, the equations of motion coupled with the Navier–Stokes equations were solved to obtain the periodic solutions that represent the hovering flight. The solutions for the two model insects are given in the electronic supplementary material.
Then, various initial disturbances were added to the periodic solution and equations (2.1) and (2.2) were solved to obtain the disturbance motions. Eight types of initial conditions were considered: (i) a horizontal velocity in xE direction, which simulated a horizontal gust in −xE direction or a head-on gust; (ii) a horizontal velocity in yE direction, which simulated a lateral gust from the right; (iii) a horizontal velocity in the direction 45° from the xE axis (or horizontal velocities in both xE and yE axes), which simulated a oblique gust; (iv) a vertical velocity in zE direction, which simulated a gust in −zE direction or an upward gust; (v) a vertical velocity in −zE direction, which simulated a gust in zE direction or a downward gust; (vi) an initial rotation about the yb-axis or an initial pitch; (vii) an initial rotation about the xb-axis or an initial roll; and (viii) an initial rotation about a line 45° from the xb-axis (rotations about both the xb- and yb-axes). For each of the types of initial conditions, initial disturbance with various magnitudes (two to five magnitudes) was considered.
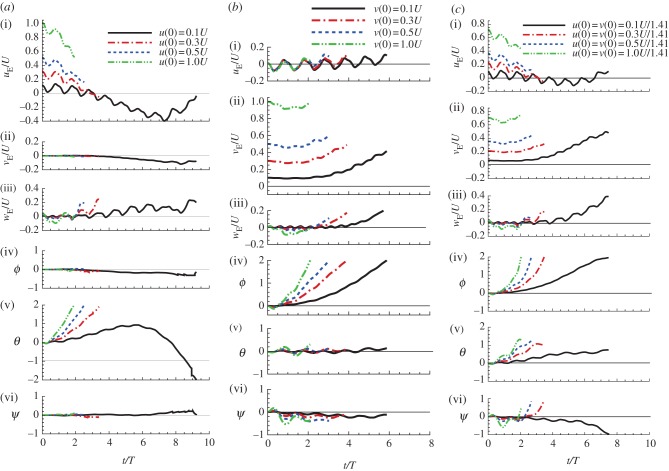
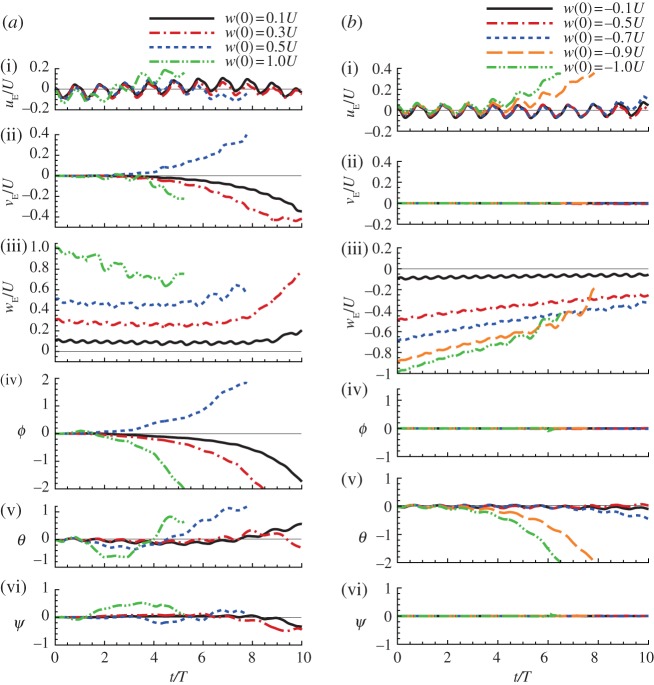
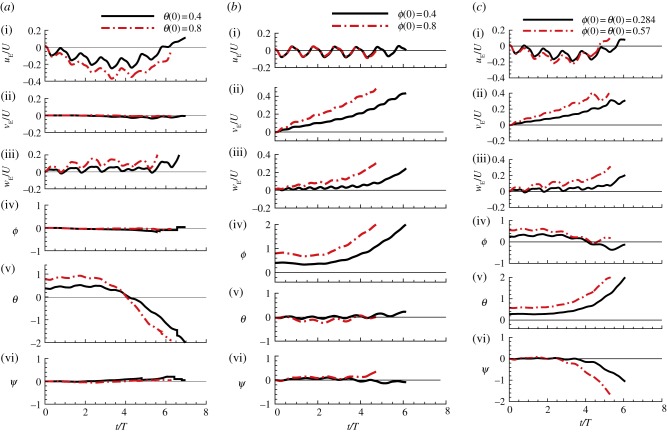
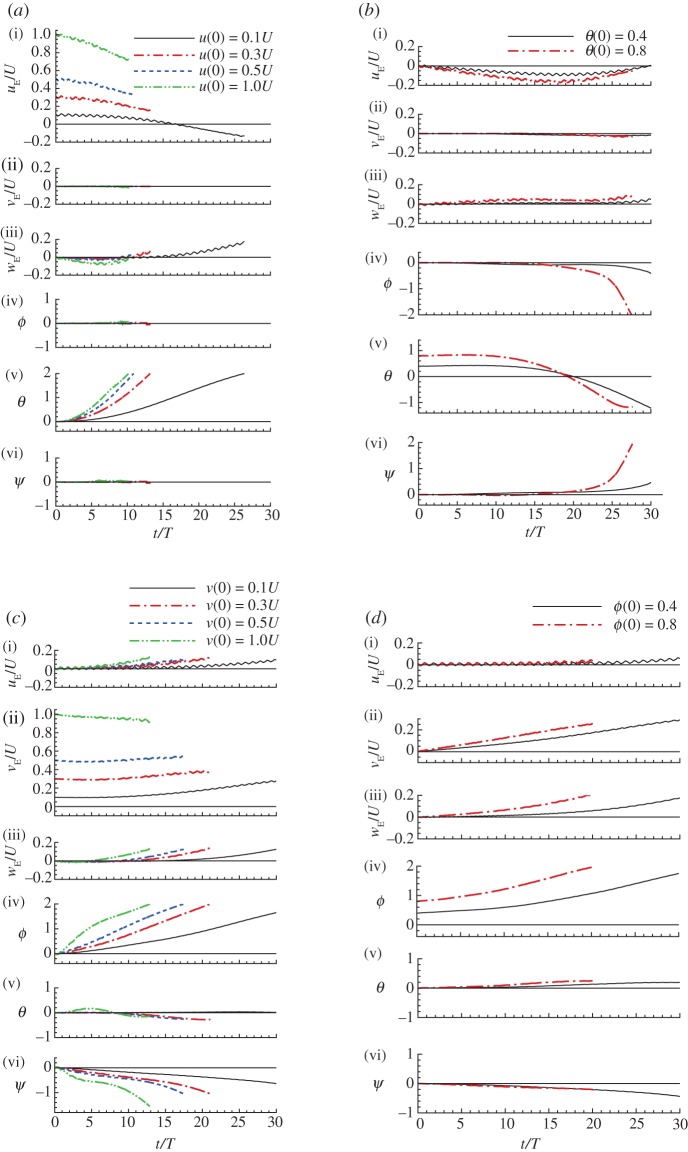
The disturbance motions are described by uE, vE and wE (velocity of the centre of mass) and ψ, θ and ϕ (body attitude) of insects. For the model hawkmoth, results of the eight types of initial conditions are shown in figures 2–4. For the model dronefly, only the results of four types of initial conditions are given here (figure 5).
Figure 2.
Disturbance motions of the model hawkmoth after horizontal gusts. (a) After a horizontal gust in the −xE direction (head-on gust): u(0)/U = 0.1, 0.3, 0.5 and 1 (other variables at t = 0 are zero). (b) After a horizontal gust in the −yE direction (lateral gust from the right): v(0)/U = 0.1, 0.3, 0.5 and 1 (other variables at t = 0 are zero). (c) After a horizontal gust in the direction 45° from the xE-axis: and 1 (other variables at t = 0 are zero). (Online version in colour.)
Figure 3.
Disturbance motions of the model hawkmoth after vertical gust. (a) After a vertical gust in the −zE direction (upward gust): w(0)/U = 0.1, 0.3, 0.5 and 1 (other variables at t = 0 are zero). (b) After a vertical gust in the zE direction (downward gust): w(0)/U = −0.1, −0.5, −0.7, −0.9 and −1 (other variables at t = 0 are zero). (Online version in colour.)
Figure 4.
Disturbance motions of the model hawkmoth after initial rotation. (a) After an initial rotation about the yE-axis (an initial pitch): θ(0) = 0.4 and 0.8 (other variables at t = 0 are zero). (b) After an initial rotation about the xE-axis (an initial roll): ϕ(0) = 0.4 and 0.8 (other variables at t = 0 are zero). (c) After an initial rotation about a line 45° from the xE-axis, ϕ(0) = θ(0) = 0.284 and 0.57 (other variables at t = 0 are zero). (Online version in colour.)
Figure 5.
Disturbance motions of the model dronefly. (a) After a head-on gust: u(0)/U = 0.1, 0.3, 0.5 and 1 (other variables at t = 0 are zero). (b) After an initial pitch: θ(0) = 0.4 and 0.8 (other variables at t = 0 are zero). (c) After a lateral gust: v(0)/U = 0.1, 0.3, 0.5 and 1 (other variables at t = 0 are zero); (d) after an initial roll: ϕ(0) = 0.4 and 0.8 (other variables at t = 0 are zero). (Online version in colour.)
4. Discussion
4.1. Hovering flight is inherently (passively) unstable
As an example, we examine the result of the model hawkmoth in figures 2–4.
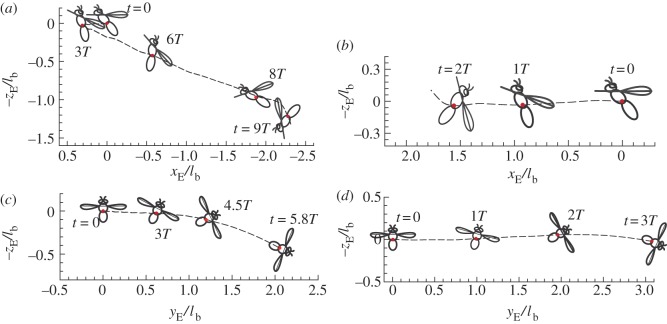
When the initial disturbance is a head-on gust (figure 2a), for relatively small initial disturbance (u(0)/U = 0.1; see the black lines in figure 2a), there are oscillations in uE and θ, i.e. the insect moves forward and backward while pitching up and down, and after approximately one oscillation, the insect tumbles and never returns to the equilibrium state, which is illustrated in figure 6a. For relatively large initial disturbance (e.g. u(0)/U = 0.5; see the blue dotted lines in figure 2a), the insect moves forward while pitching up, and tumbles after a short time, which is illustrated in figure 6b. When the initial disturbance is a pitch angle (figure 4a), for small and large initial disturbances (θ(0) = 0.4 (23°) and 0.8 (46°)), there are oscillations in θ and uE, i.e. the insect pitches up and down while moving backward and forward, and after less than one oscillation, the insect tumbles. We call the above-mentioned instabilities ‘pitch instability’. For the cases of small longitudinal initial disturbances (u(0)/U = 0.1 in figure 2a; θ(0) = 0.4 in figure 4a), the disturbance motions are similar to those predicted by linear theory in previous studies [2,5,7].
Figure 6.
Spatial location of centre of mass and body orientation of the hawkmoth in disturbance motion. (a) After a head-on gust, u(0)/U = 0.1; (b) after a head-on gust, u(0)/U = 0.5. (c) After a lateral gust, v(0)/U = 0.1; (d) after a lateral gust, v(0)/U = 0.5. (Online version in colour.)
When the initial disturbance is a lateral velocity to the right (figure 2b), for small and large initial disturbances (v(0)/U = 0.1–1), the insect moves to the right while rolling to the same direction, and tumbles in about 5.5 wingbeat cycles for v(0)/U = 0.1 and in about three wingbeat cycles for v(0)/U = 0.5; this is illustrated in figure 6c,d. When the initial disturbance is a roll angle (figure 4b), for small and large initial disturbances (ϕ(0) = 0.4 and 0.8), the insect rolls to the right while moving to the same direction, and tumbles in about 5.5 wingbeat cycles for ϕ(0) = 0.4 and in about four wingbeat cycles for ϕ(0) = 0.8. We call the above-mentioned instabilities ‘roll instability’. For the cases of small lateral initial disturbances (v(0)/U = 0.1 in figure 2b; ϕ(0) = 0.4 in figure 4b), again, the disturbance motions are similar to those predicted by linear theory in previous studies [4,26].
When the initial disturbance is a oblique gust (figure 2c), the longitudinal motion is similar to that of the case of a head-on gust (comparing uE, wE and θ in figure 2c with those in figure 2a), and the lateral motion is similar to that of the case of lateral gust (comparing vE, ϕ and ψ in figure 2c with those in figure 2b). The motion has both ‘pitch instability’ and ‘roll instability’, but the stabilities grow a little slower than those in the cases of head-on gust and lateral gust (e.g. ϕ in figure 2c grows to 2 at t/T = 7.5, but ϕ in figure 2b grows to 2 at t/T = 6). When the initial disturbance has pitch and roll rotations (figure 4c), uE and θ are similar to those of the case in which the initial disturbance is a pitch rotation (comparing uE and θ in figure 4c with those in figure 4a), and vE and ϕ are similar to those of the case in which the initial disturbance is a roll rotation (comparing vE and ϕ in figure 4c with those in figure 4b). Again, the motion has both ‘pitch instability’ and ‘roll instability’.
When the initial condition is an upward gust, or the insect has an initial downward velocity, wE(0) > 0 (figure 3a), the downward velocity decreases at first (for wE(0) = 1, wE decreases with time until t/T = 4.5; for w(0)/U = 0.1, wE decreases with time until t/T = 8), and the vertical motion seems to be stable. But at later times, θ (and uE) and ϕ (and vE) grows quickly with time, i.e. the ‘pitch instability’ and ‘roll instability’ have developed. When the initial condition is a downward gust, or insect having an initial upward velocity, w(0)/U < 0 (figure 3b), the magnitude of wE also decreases with time, and the vertical motion seems to be stable, but at longer times, ‘pitch instability’ develops. The larger the initial upward velocity, the earlier the instability develops.
Similar observations can be made from the disturbance motions of the model dronefly (figure 5). We see that for the initial conditions considered, the disturbance motion grows with time and the insect tumbles and never returns to the equilibrium state. We thus conclude that hovering flight of the model insects is inherently (passively) unstable.
4.2. Physical mechanisms of instability
We still take the model hawkmoth (figures 2–4) as an example. Let F0 denote the wingbeat-cycle-averaged vertical aerodynamics force during hovering (F0 = mg); let  and
and  denote the wingbeat-cycle-averaged vertical aerodynamic pitch and roll moments in the disturbance motion; let S denote the area of the wing pair (in figure below, the superscript asterisk denotes a non-dimensional quantity; a force is non-dimensionalized by 0.5ρU2S and a moment by 0.5ρU2Sc).
First, we discuss the ‘pitch instability’ in figure 2a (or in figure 6a,b), i.e. the disturbance motion owing to an initial forward velocity or a head-on gust. In this case, as seen in figure 2a, the disturbance motion mainly has variations in the horizontal velocity (uE) and pitch angle (θ). In figure 7, we plot uE and θ, together with the pitch moment ( ) and the horizontal force owing to tilting the weight-supporting vertical force, F0sin(–θ). At the beginning (t/T = 0−1), the insect moves forward at the initial velocity (figure 7a), and a positive
  (pitch-up moment) is produced (figure 7c). The pitch-up moment makes θ increase (figure 7b), resulting in a negative horizontal force, F0sin(–θ) (figure 7d). The negative F0sin(–θ) will decrease the forward-motion velocity. In the cases of large initial forward velocities (u(0) = 0.3, 0.5 and 1), because the pitch moment is very large, θ grows very fast and before the forward-motion velocity decreases to zero, the insect tumbles. In the cases of relatively small initial forward velocities, the pitch moment is not very large, θ grows relatively slowly. For example, for the case of u(0) = 0.1, uE decreases to zero at t/T ≈ 3 and continues to decreases to a negative value (figure 7a), and a negative
  (pitch-down moment) is produced (figure 7c). The negative
  would decrease θ; however, because there is a time lag between moment and angular change, θ keeps increasing to a large value (about 50°) and remains positive until t/T ≈ 7.5 (figure 7b). During this period (t/T ≈ 3−7.5), the large and negative F0*sin(−θ) accelerates the insect and increases the negative uE to large magnitudes at t/T ≈ 7.5, which produces a large, negative pitch moment (figure 7c, t/T ≈ 7.5). Now, the situation is similar to the cases of large initial forward velocities discussed earlier: a large pitch moment makes θ grow very fast and the insect tumbles. We thus see that for the case of large initial velocity, the large velocity at the first few wingbeats produces a large pitch moment that causes the insect to tumble. For the case of small initial velocity, pitching motion and forward (or backward) motion enhance each other, driving the forward (or backward) velocity to a large value, and the large velocity produces a large pitch moment that causes the insect to tumble. That is, in both cases, it is the large pitch moment produced by forward (or backward) velocity that causes the insect to tumble, causing the instability. How the forward (or backward) velocity produces pitch moment can be readily explained: when the insect moves forward, in the downstroke, the wings would see a larger relative velocity than that in hovering flight and the drag of a wing is larger than that in hovering flight, whereas in the upstroke, the wings would see a smaller relative velocity than that in hovering flight and the drag is smaller than that in hovering flight. This will result in a wingbeat-cycle mean force in the negative xb-direction. Because the stroke plane is above the centre of mass, this force will produce a positive pitch moment. Similarly, when the insect moves backward a negative pitch moment will be produced.
Figure 7.
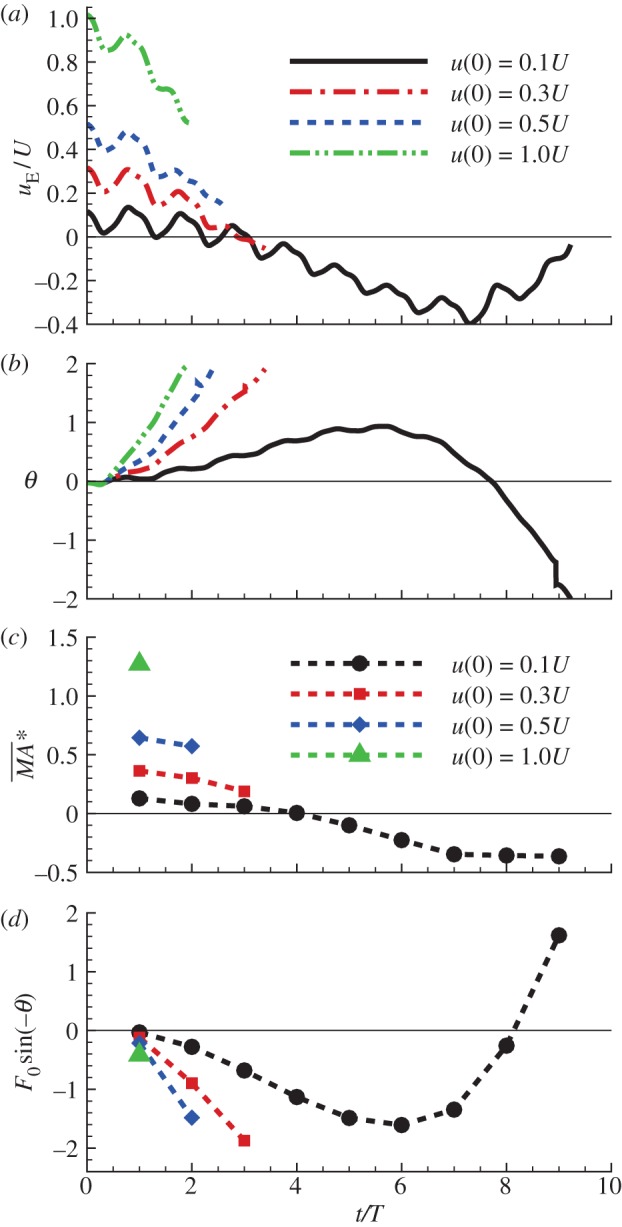
Pitch moment and horizontal force owing to tilting the weight-supporting vertical force of the hawkmoth in the disturbance motion, after a head-on gust: u(0)/U = 0.1, 0.3, 0.5; other variables at t = 0 are zero. (Online version in colour.)
Next, we look at the ‘pitch instability’ in figure 4a, i.e. the disturbance motion owing to an initial pitch angle. Analysis similar to the above has shown that the pitch angle gives a horizontal force, F0sin(−θ), resulting in backward motion and pitching motion; the horizontal motion and pitching motion enhance each other, driving the backward velocity to a large value; the large velocity produces a large pitch moment that causes the insect to tumble.
Third, we discuss ‘roll instability’ in figure 2b (or in figure 6c,d), i.e. the disturbance motion owing to an initial lateral velocity or a lateral gust. In this case, the disturbance motion mainly has variations in the horizontal velocity (vE) and roll angle (ϕ; figure 2b). In figure 8a, we plot vE and ϕ, together with the roll moment  and the lateral horizontal force owing to tilting the weight-supporting vertical force, F0*sin(ϕ). As seen in figure 8a, the insect moves to the right (vE(t) > 0) at the initial velocity in the beginning (figure 8a(i), t/T = 0−2) and then vE(t) increases (figure 8a(ii), t/T = 2−3); a positive roll moment,
  , is produced during the side-translational motion (figure 8a(iii), t/T = 0−3); at t/T = 1−2, the insect starts to roll to the right (ϕ > 0) (figure 8a(ii), t/T = 1.5−4). From these data, the development of the instability can be clearly seen (as illustrated in figure 8b): the insect moves to the right and a right-side rolling moment
  (>0) is produced by the side-translational velocity (how the roll moment is produced will be discussed below); the moment
  rolls the insect to the right (ϕ > 0), tilting the vertical force (F0 = mg) to the right; the horizontal component of F0 would enhance the side-translational motion and the roll moment produced by the side-translational motion would enhance the roll, resulting in the instability. Now let us explain how the side-translational velocity could produce a roll moment. When using linear analysis to study the lateral stability of hovering insects, Zhang & Sun [4] and Xu & Sun [26] found that right-side (or left-side) translational velocity will produce a positive (or negative) roll moment, the reasons for which are as follows. When the insect conducts a side-translational motion to the right side, the left wing sees a relative velocity that is approximately directed from wing-root to wing-tip, whereas the right wing sees a relative velocity that is approximately directed from wing-tip to wing-root. Flow velocity from wing-root to wing-tip of the left wing would increase the axial velocity of its leading-edge vortex (LEV) and make the LEV more concentrated than that of the equilibrium flight (hovering flight), whereas flow velocity from wing-tip to wing-root of the right wing would decrease the axial velocity of its LEV and make the LEV more diffused than that of the equilibrium flight. This will result in a larger lift on the left wing and a smaller lift on the right wing, producing the positive roll moment. Similarly, a left-side-translational motion will produce a negative roll moment. In the above-mentioned studies [4,26], only small disturbance motions were considered. But, it is obvious that this mechanism would exist also when side-translational velocity is large. This is confirmed by our data. As an example, figure 9 shows a comparison between the LEVs of the left and right wings at v(0)/U = 0.5. It is seen that the LEV on the right wing is much more diffused than that on the left wing.
Figure 8.
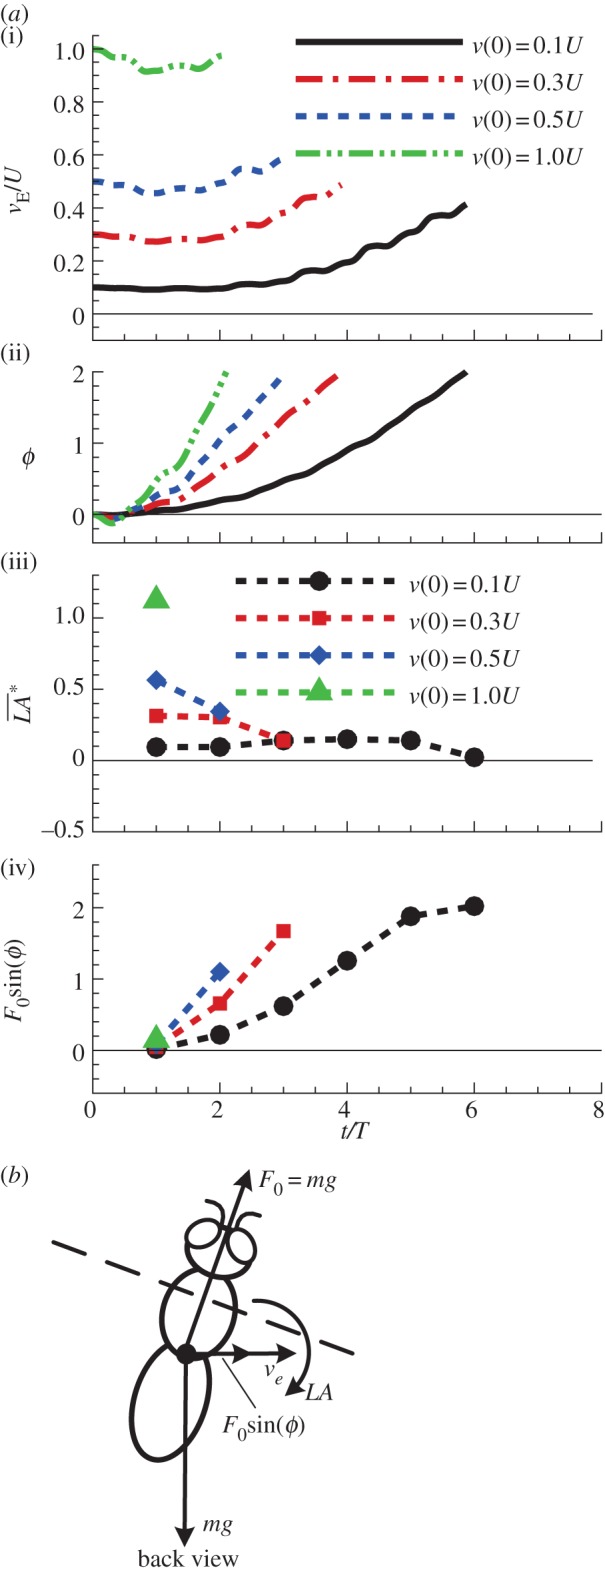
(a) Roll moment and horizontal force owing to tilting the weight-supporting vertical force of the hawkmoth in the disturbance motion, after a lateral gust: v(0)/U = 0.1, 0.3, 0.5; other variables at t = 0 are zero. (b) A sketch illustrating the mutual enhancement of the side-translational motion and the roll motion. (Online version in colour.)
Figure 9.
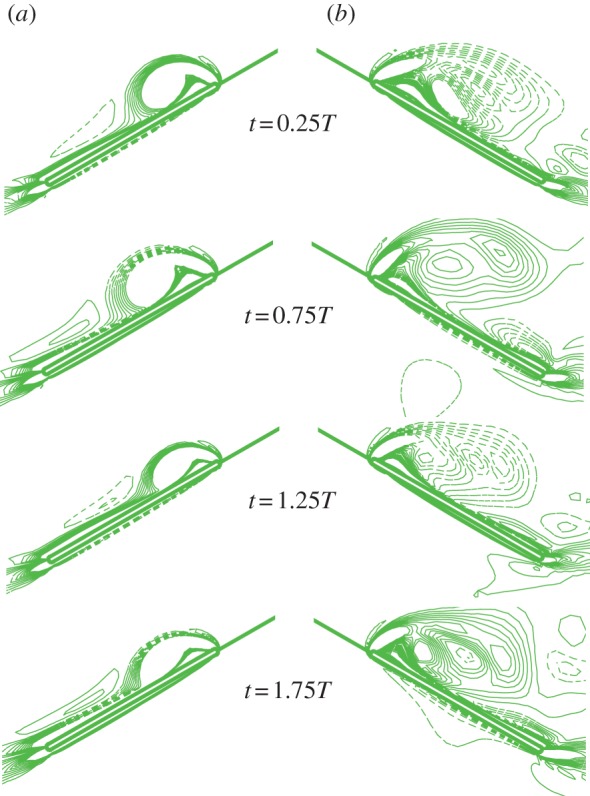
(a) Vorticity plots at 0.7R wing-section at various time for the wings of the hawkmoth in the disturbance motion, after a head-on gust: u(0)/U = 0.5; other variables at t = 0 are zero. (a) Left wing; (b) right wing. Solid and broken lines indicate positive and negative vorticity, respectively. The magnitude of the non-dimensional vorticity (non-dimensioned by c/U) at the outer contour is 2 and the contour interval is 3. (Online version in colour.)
Finally, let us look at the ‘roll instability’ in figure 4b, i.e. the disturbance motion owing to an initial roll angle. Analysis similar to the previous paragraph has shown that the roll angle gives a horizontal force, F0sin(ϕ), resulting in a right-side horizontal motion and roll motion; the horizontal motion and roll motion enhance each other, resulting in instability. The instabilities in other disturbance motions considered in the previous section are either a ‘pitch instability’ or a ‘roll instability’ and can be similarly explained.
4.3. Comparison with linear theory
When a nonlinear problem is linearized about an equilibrium point, the linearized equation of small perturbation about the equilibrium point can be solved analytically. When the full nonlinear equation is solved numerically for disturbance motions about the equilibrium point, in the case of the perturbation is small, the numerical solution should be approximately the same as the analytical solution. In fact, this can serve as a test of the numerical solution.
Here, we compare the present nonlinear solution with the analytical solution. It is expected that for small disturbance motion, the numerical solution is close to the analytical one. For the hovering hawkmoth and dronefly, the analytical solution of small disturbance motion was obtained by our group [11–13]:
 |
4.1a |
and
 |
4.1b |
where λi and  (i = 1–4) are the longitudinal eigenvalues and eigenvectors, respectively, and λi and
  (i = 5–8) are the lateral eigenvalues and eigenvectors, respectively; ai(i = 1–8) is constants. λi and
  (i = 1–8) are given in references [11,12], ai is determined by given initial conditions.
Electronic supplementary material, figure S6 compares the numerical and analytical results of the model hawkmoth when the initial disturbances are u(0)/U = 0.1 and v(0)/U = 0.1, respectively. The initial disturbances are small. As is expected, in the early time (t/T ≈ 0–2), before the disturbance motion grows large, the numerical solution is close to the analytical solution; however, when the disturbance motion grows large (t/T > 2), discrepancies between the nonlinear and linear solutions become large. Electronic supplementary material, figure S7 shows the corresponding results for the dronefly; the comparison is similar.
5. Conclusions
— For small and large initial disturbances, the disturbance motion grows with time and the insects tumble and never return to the equilibrium state; hovering flight of the model insects is inherently (passively) unstable.
— The instability is mainly caused by a large positive (and/or negative) pitch moment produced by the forward (and/or backward) velocity, and/or a large positive (or negative) roll moment produced by the right (or left) side-velocity of the insect.
Acknowledgements
This research was supported by grants from the National Natural Science Foundation of China (11232002), the PhD Student Foundation of Chinese Ministry of Education (30400002011105001) and the 111 Project (B07009).
References
- 1.Taylor GK, Thomas ALR. 2003. Dynamic flight stability in the desert locust Schistocerca gregaria. J. Exp. Biol. 206, 2803–2829 10.1242/jeb.00501 (doi:10.1242/jeb.00501) [DOI] [PubMed] [Google Scholar]
- 2.Sun M, Xiong Y. 2005. Dynamic flight stability of a hovering bumblebee. J. Exp. Biol. 208, 447–459 10.1242/jeb.01407 (doi:10.1242/jeb.01407) [DOI] [PubMed] [Google Scholar]
- 3.Sun M, Wang JK, Xiong Y. 2007. Dynamic flight stability of hovering insects. Acta Mech. Sin. 208, 447–459 10.1242/jeb.01407 (doi:10.1242/jeb.01407) [DOI] [PubMed] [Google Scholar]
- 4.Zhang Y, Sun M. 2010. Dynamic flight stability of a hovering model insect: lateral motion. Acta Mech. Sin. 26, 175–190 10.1007/s10409-009-0303-1 (doi:10.1007/s10409-009-0303-1) [DOI] [Google Scholar]
- 5.Faruque I, Humbert JS. 2010. Dipteran insect flight dynamics. I. Longitudinal motion about hover. J. Theor. Biol. 264, 538–552 10.1016/j.jtbi.2010.02.018 (doi:10.1016/j.jtbi.2010.02.018) [DOI] [PubMed] [Google Scholar]
- 6.Faruque I, Humbert JS. 2010. Dipteran insect flight dynamics. II. Lateral-directional motion about hover. J. Theor. Biol. 265, 306–313 10.1016/j.jtbi.2010.05.003 (doi:10.1016/j.jtbi.2010.05.003) [DOI] [PubMed] [Google Scholar]
- 7.Cheng B, Deng XY. 2011. Translational and rotational damping of flapping flight and its dynamics and stability at hovering. IEEE Trans. Robot. Autom. 27, 849–864 10.1109/TRO.2011.2156170 (doi:10.1109/TRO.2011.2156170) [DOI] [Google Scholar]
- 8.Schenato L, Wu WC, Sastry S. 2004. Attitude control for a micromechanical flying insect via sensor output feedback. IEEE Trans. Robot. Autom. 20, 93–106 10.1109/TRA.2003.820863 (doi:10.1109/TRA.2003.820863) [DOI] [Google Scholar]
- 9.Deng XY, Schenato L, Wu WC, Shankar S. 2006. Flapping flight for biomimetic robotic insects. I. System modeling. IEEE Trans. Robot. Autom. 22, 776–788 10.1109/TRO.2006.875480 (doi:10.1109/TRO.2006.875480) [DOI] [Google Scholar]
- 10.Etkin B, Reid LD. 1996. Dynamics of flight: stability and control. New York, NY: Wiley [Google Scholar]
- 11.Zhang Y, Sun M. 2010. Dynamic flight stability of hovering model insects: theory versus simulation using equations of motion coupled with Navier–Stokes equations. Acta Mech. Sin. 26, 509–520 10.1007/s10409-010-0360-5 (doi:10.1007/s10409-010-0360-5) [DOI] [Google Scholar]
- 12.Zhang Y, Sun M. 2012. Lateral dynamic flight stability of hovering insects: theory versus numerical simulation. Acta Mech. Sin. 28, 221–231 10.1007/s10409-012-0011-0 (doi:10.1007/s10409-012-0011-0) [DOI] [Google Scholar]
- 13.Wu JH, Sun M. 2012. Floquet stability analysis of the longitudinal dynamics of two hovering model insects. J. R. Soc. Interface 9, 2033–2046 10.1098/rsif.2012.0072 (doi:10.1098/rsif.2012.0072) [DOI] [PMC free article] [PubMed] [Google Scholar]
- 14.Combes SA, Dudley R. 2009. Turbulence-driven instabilities limit insect flight performance. Proc. Natl Acad. Sci. USA 16, 9105–9108 10.1073/pnas.0902186106 (doi:10.1073/pnas.0902186106) [DOI] [PMC free article] [PubMed] [Google Scholar]
- 15.Taylor GK, Zbikowski R. 2005. Nonlinear time-periodic models of the longitudinal flight dynamics of desert locusts Schistocerca gregaria. J. R. Soc. Interface 2, 197–221 10.1098/rsif.2005.0036 (doi:10.1098/rsif.2005.0036) [DOI] [PMC free article] [PubMed] [Google Scholar]
- 16.Liu H, Nakata T, Gao N, Maeda M, Aono H, Shyy W. 2010. Micro air vehicle-motivated computational biomechanics in bio-flights: aerodynamics, flight dynamics and maneuvering stability. Acta Mech. Sin. 26, 863–879 10.1007/s10409-010-0389-5 (doi:10.1007/s10409-010-0389-5) [DOI] [Google Scholar]
- 17.Sun M, Lan SL. 2004. A computational study of the aerodynamic forces and power requirements of dragonfly (Aeschna junces) hovering. J. Exp. Biol. 207, 1887–1901 10.1242/jeb.00969 (doi:10.1242/jeb.00969) [DOI] [PubMed] [Google Scholar]
- 18.Sun M, Yu X. 2006. Aerodynamic force generation in hovering flight in a tiny insect. AIAA J. 44, 1532–1540 10.2514/1.17356 (doi:10.2514/1.17356) [DOI] [Google Scholar]
- 19.Yu X, Sun M. 2009. A computational study of the wing–wing and wing–body interactions of a model insect. Acta Mech. Sin. 25, 421–431 10.1007/s10409-009-0266-2 (doi:10.1007/s10409-009-0266-2) [DOI] [Google Scholar]
- 20.Liu Y, Sun M. 2008. Wing kinematics measurement and aerodynamics of hovering droneflies. J. Exp Biol. 211, 2014–2025 10.1242/jeb.016931 (doi:10.1242/jeb.016931) [DOI] [PubMed] [Google Scholar]
- 21.Ellington CP. 1984. The aerodynamics of hovering insect flight. II. Morphological parameters. Phil. Trans. R. Soc. Lond. B 305, 17–40 10.1098/rstb.1984.0050 (doi:10.1098/rstb.1984.0050) [DOI] [Google Scholar]
- 22.Ellington CP. 1984. The aerodynamics of hovering insect flight. III. Kinematics. Phil. Trans. R. Soc. Lond. B 305, 41–78 10.1098/rstb.1984.0051 (doi:10.1098/rstb.1984.0051) [DOI] [Google Scholar]
- 23.Willmott AP, Ellington CP. 1997. The mechanics of flight in the hawkmoth Manduca sexta. I. Kinematics of hovering and forward flight. J. Exp. Biol. 200, 2705–2722 [DOI] [PubMed] [Google Scholar]
- 24.Willmott AP, Ellington CP. 1997. The mechanics of flight in the hawkmoth Manduca sexta. II. Aerodynamic consequences of kinematic and morphological variation. J. Exp. Biol. 200, 2723–2745 [DOI] [PubMed] [Google Scholar]
- 25.Wu JH, Zhang YL, Sun M. 2009. Hovering of model insects: simulation by coupling equations of motion with Navier–Stokes equations. J. Exp. Biol. 212, 3313–3329 10.1242/jeb.030494 (doi:10.1242/jeb.030494) [DOI] [PubMed] [Google Scholar]
- 26.Xu N, Sun M. 2013. Lateral dynamic flight stability of a model bumblebee in hovering and forward flight. J. Theor. Biol. 319, 102–115 10.1016/j.jtbi.2012.11.033 (doi:10.1016/j.jtbi.2012.11.033) [DOI] [PubMed] [Google Scholar]


