
Figure 2.
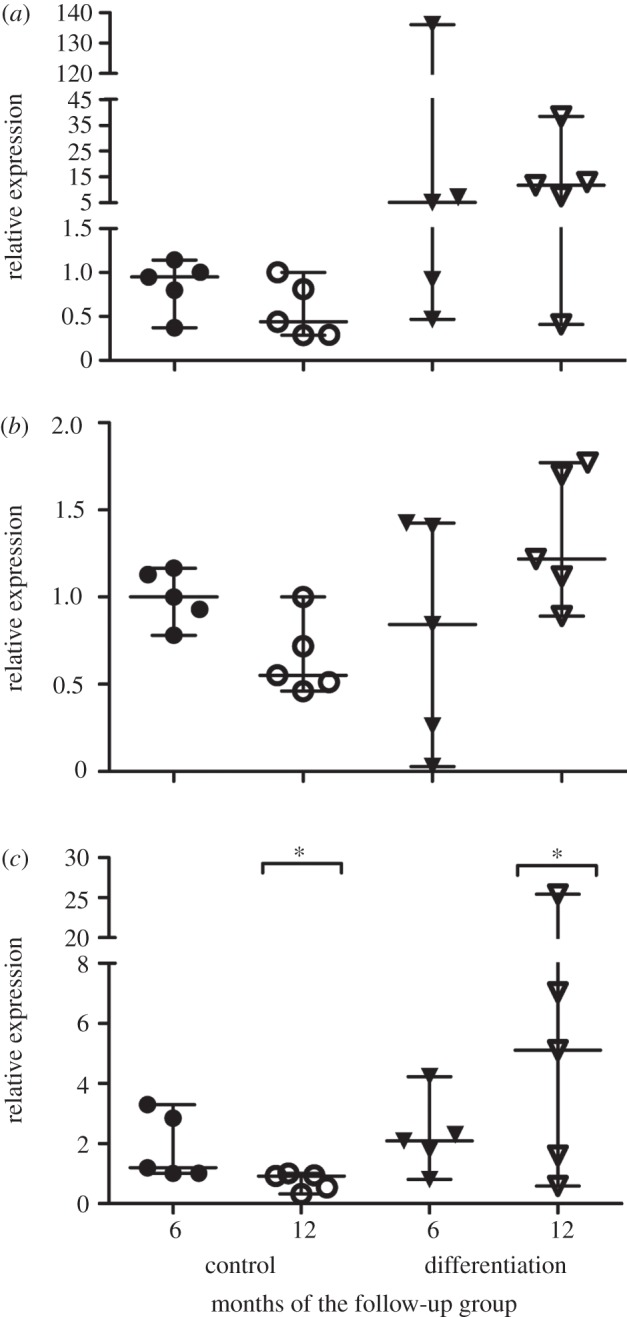
The relative expression levels of (a) aggrecan, (b) type I and (c) II collagen of the ASC discs after one week pre-culture prior to implantation measured by qRT-PCR. The six and 12 months denote the division of the rabbits in the subsequent follow-up groups. The difference in type II collagen expression between the control and differentiated ASC discs in the 12-month group was found statistically significant and is denoted by an asterisk (p < 0.05).