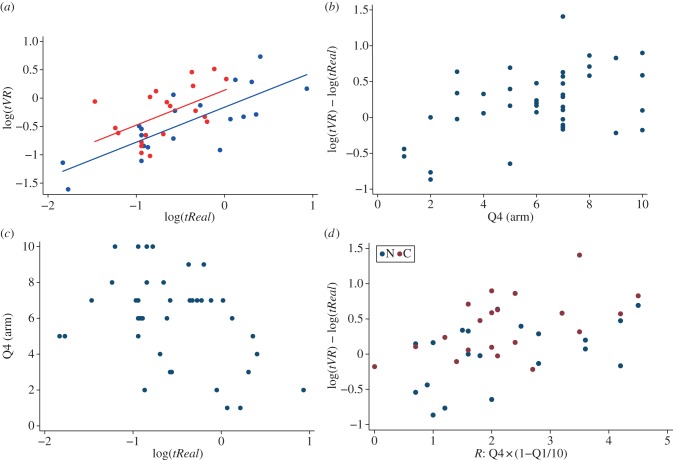
Figure 5.
Scatter plots for TST and questionnaire responses. (a) Scatter plot of tVR by tReal on the log scale, with regression lines for analysis of covariance with condition as the factor. Here, R2 = 0.49 and the significance levels for the slope and intercept are p < 0.0005 and p = 0.02, respectively. Blue solid line denotes fitted values (N) and red solid line denotes fitted values (C). Blue circles denote N and red circles denote C. (b) Scatter diagram of Δlogt on Q4 (arm); R2 = 0.23, p < 0.002. (c) Scatter diagram of Q4 on log(tReal); R2 = 0.16, p = 0.011. (d) Scatter plot of Δlogt on R = Q4 × (1 − Q1/10) by condition; R2 = 0.38, significance levels for slope and intercept are p = 0.001 and p = 0.003, respectively. Blue circles denote N and brown circles denote C. All tests satisfy normality requirements on the residual errors of the corresponding regression equation using the Shapiro–Wilks test (all p for residual errors compatible with a normal distribution p > 0.12).

