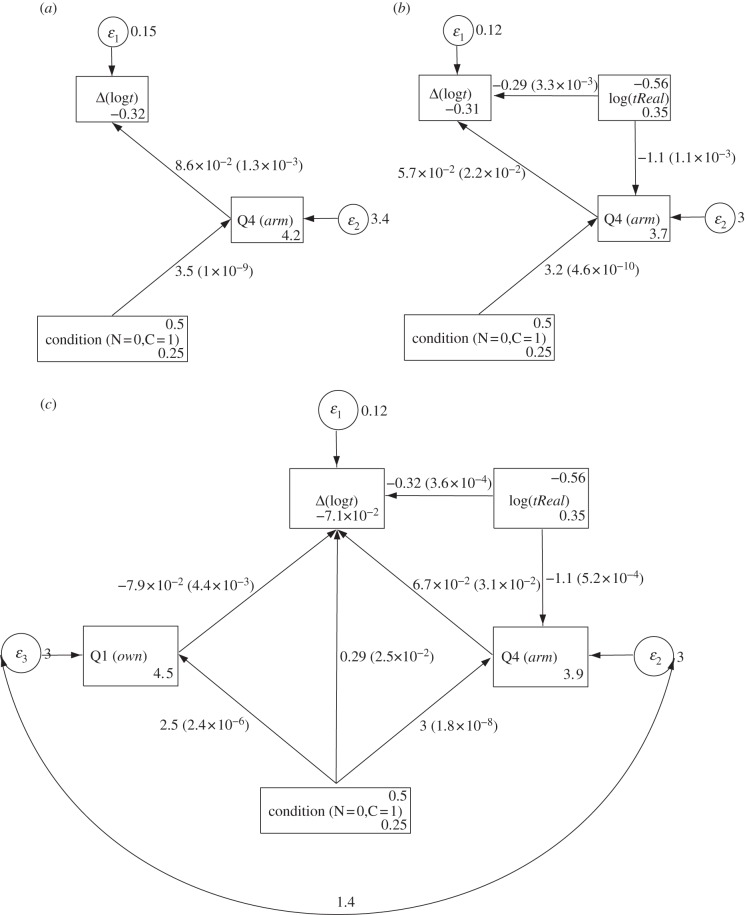
Figure 6.
Path diagrams for decomposition of influences on Δlogt and R. (a) Path analysis for Δlogt on condition and Q4. (b) Path analysis for Δlogt including the effect of log(tReal). (c) Full path analysis. The path analyses use the asymptotic distribution free method for estimation and significance testing (and hence do not rely on multivariate normal assumptions). The annotations on the path lines indicate the path coefficient (with the corresponding significance level in brackets). The curved path represents the inclusion of a covariance term between the connected items.

