Abstract
Plants display a range of striking architectural adaptations when grown at elevated temperatures. In the model plant Arabidopsis thaliana, these include elongation of petioles, and increased petiole and leaf angles from the soil surface. The potential physiological significance of these architectural changes remains speculative. We address this issue computationally by formulating a mathematical model and performing numerical simulations, testing the hypothesis that elongated and elevated plant configurations may reflect a leaf-cooling strategy. This sets in place a new basic model of plant water use and interaction with the surrounding air, which couples heat and mass transfer within a plant to water vapour diffusion in the air, using a transpiration term that depends on saturation, temperature and vapour concentration. A two-dimensional, multi-petiole shoot geometry is considered, with added leaf-blade shape detail. Our simulations show that increased petiole length and angle generally result in enhanced transpiration rates and reduced leaf temperatures in well-watered conditions. Furthermore, our computations also reveal plant configurations for which elongation may result in decreased transpiration rate owing to decreased leaf liquid saturation. We offer further qualitative and quantitative insights into the role of architectural parameters as key determinants of leaf-cooling capacity.
Keywords: plant architecture, petiole elongation, leaf hyponasty, transpiration, mathematical modelling, computational partial differential equations
1. Introduction
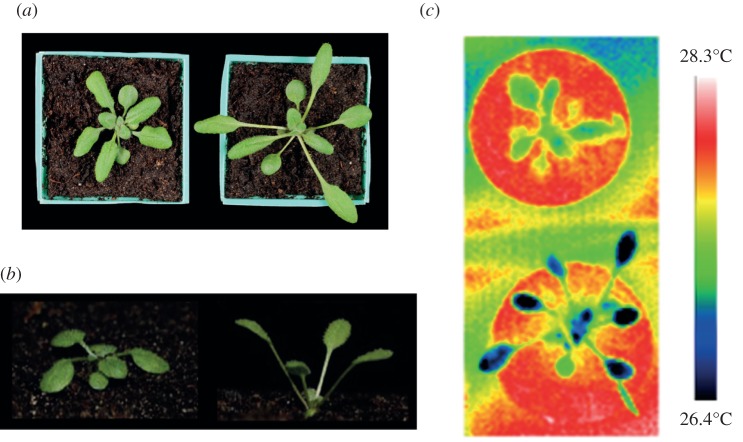
Plants growing in natural environments are exposed to fluctuating ambient temperatures, and have therefore evolved a variety of temperature-mediated developmental adaptations to enhance productivity and promote survival. Architectural responses to growth at elevated temperatures include elongation of stems and petioles (leaf stems), and increased leaf angles from the soil surface (hyponasty), as observed in the model species Arabidopsis thaliana (figure 1). The promotion of elongation growth at high temperature involves elevation of the plant hormone auxin, and the molecular control of this process is starting to be elucidated [1,3–5]. Despite the striking nature of these phenotypes, their potential physiological significance remains speculative. High air temperature likely imposes two major physiological stresses on plants: heating of plant tissues and increased loss of water through pores (stomata) on the surface of leaves where liquid water evaporates (transpiration) [6–9].
Figure 1.
Observed architectural features of Arabidopsis thaliana shoots grown at different temperatures. (a) Aerial photographs of plants pre-grown for 2 weeks in continuous irradiation at 22°C before transfer to 22°C (left) or 28°C (right) for a further 2 weeks. (b) Side profile of Arabidopsis shoots pre-grown on soil for 2 weeks at 22°C before transfer to 22°C (left) or 28°C (right) for a further week, showing elongated and elevated petioles at higher growth temperature. Figure adapted from Koini et al. [1], with permission from Elsevier. (c) Thermal images of plants grown at 22°C (top) and 28°C (bottom), when placed in a 28°C environment. Blue corresponds to lowest temperature, whereas red corresponds to highest. Leaves in elongated plant are approximately 1°C cooler than compact plant. Figure adapted from Crawford et al. [2], with permission from Elsevier.
High-temperature-induced elongation growth and leaf hyponasty (elevation) have been suggested to reduce heat damage, through decreasing the exposure of leaves to direct sunlight and raising photosynthetic structures towards cooling breeze [3,10]. A recent study [2] has compared the cooling and water use of Arabidopsis plants that were pre-grown at different temperatures, resulting in significantly different shoot architectures. When subsequently placed in identical humidity- and temperature-controlled environments, the plants previously grown in high-temperature conditions showed enhanced water loss and leaf-cooling capacity when compared with controls grown at a lower temperature (figure 1c), despite the former showing no increase in leaf stomatal pore area. These data support the possibility that temperature-mediated changes in plant architecture may directly affect water movement and leaf temperature, and raise the question of whether petiole elongation and elevation could represent a leaf-cooling strategy.
Water-use efficiency is a priority area in plant science research, particularly with regard to growth at elevated temperatures associated with global climate change [9]; here, we aim to use mathematical models to explore the relationship between plant geometry, water flow and leaf temperature, initially through simulation of the experimental conditions in Crawford et al. [2]. Transpiration has previously been modelled in a number of crops and trees, to provide predictions of water usage within canopies [11]. None of these models incorporates temperature-mediated alterations in plant architecture.
Existing models of water use in plants range from models for soil–plant interactions [12] to studies of water flow in the xylem of plants, which provides a simple ‘pathway’ for water transport. Water in plants moves as a result of gradients in chemical concentrations, hydrostatic pressure and gravity. The flow of water in green plants is reviewed in Rand [13], where a slow xylem flow is described. Mathematical models of the dynamics of water flow in plants have incorporated the pathway effects from roots to leaves to the atmosphere for certain species. In Janott et al. [14], a one-dimensional xylem flow model is coupled to plant architecture above and below ground in higher dimensions, to simulate sap flow in trees. No direct feedback of the transpiration to the leaf microenvironment is considered, however.
Physiologically, water flow through plants is, in stems, via a system of xylem vessel elements and tracheids, arranged into vascular bundles [15], whereas leaves (which are seen to be of the order of 10 cells thick for Arabidopsis [16]; K. A. Franklin 2012, unpublished images) have a complicated combination of petiole, vein networks of varying sizes and pathways outside the vein xylem [17]. While Poiseuille's law for pipe flow is sometimes used to model water flow in plants, this models only the flow through single pipes with no obstructions. Instead, we will attempt to take account of the complex structure of the entire water transport medium by modelling it as a porous medium; the distinction is discussed further in Vilagrosa et al. [18]. Porous-medium-type flow models in plants are discussed in recent studies [19,20], where the need for numerical simulations in two- and three-dimensions as well as hydraulic functions dependent on water saturation are highlighted. The hydraulic system of trees is also studied in Früh & Kurth [21], where porous medium flow is combined with a water storage model, with architectural parameters of trees used as inputs to the model. A model that predicts water potential in a tree is given in Kumagai [22]; however, this quantity is not always easily measured. A further model for the hydraulic system of a conifer tree is described in Chuang et al. [23], where sap flux is explicitly output from simulations in order to compare with experimental data.
The earlier-highlighted models typically have mass flow driven by prescribed transpiration rates, implemented by adding sink terms to the mass conservation equations over intervals (in one-dimensional models) which represent the plant canopies or crowns. Our current investigation into the effect of high-temperature-mediated, developmentally plastic adaptations on water use and leaf temperature in small plants will go further by coupling of a suitable mass flow model with variable temperature effects, and consideration of the transpirational mechanism coupled to both heat and mass transfer.
A guide for modelling both heat and mass transfer in porous media with evaporation can be taken from a number of mathematical studies including [24–29]. Crucial to the model of transpiration that we develop in this paper is the specification of suitable boundary conditions between stomata-covered leaf surfaces and the adjacent free air, balancing heat and mass fluxes with evaporation rates, as in Liu et al. [26]. Such conditions, which take into account the saturation pressure of water in air, are also seen in the models of soil drying [30]. Furthermore, evaporation and water transfer from wet surfaces and leaves have been modelled in detail from first principles [31,32], leading to the Penman–Monteith equation for evaporation rate as a function of saturation vapour pressure deficit. A model, which uses a similar evaporation term, has recently been used to study the effect of leaf separation on evaporative cooling and water loss rates from isolated leaves [33]. It predicts water vapour concentration in the air surrounding the leaves, as well as temperature throughout the leaves, with water loss from the lower leaf stomata being dependent on these two quantities at the leaf–air boundary, but includes neither the effects of water supply to leaves, nor a realistic plant architecture.
In this paper, we combine the various model ingredients currently available in the literature into a more complete model for heat and mass transfer with varying plant shoot geometry, motivated primarily by the need to understand the physiological significance of the elongation and elevation of petioles at high-temperature growth conditions in Crawford et al. [2]. In particular, the model is developed to simulate both the phenotypes and experimental conditions described in Crawford et al. [2]. For the first time, we present a two-dimensional model of heat and mass transfer in the disjoint domains of plant shoot and surrounding air, coupled by transpiration conditions (with transpiration dependent on leaf temperature, water content and vapour concentration) at the lower boundaries of leaves. We report on the mathematical model and computational solution framework, and, motivated by the results and hypothesis of Crawford et al. [2], we study model predictions of the effects on leaf cooling of variations in petiole length and petiole angle to the ground. In doing so, we further support the hypothesis that leaf separation and plant height from the soil surface enhance leaf evaporative cooling at high temperature.
2. Mathematical formulation
We begin by describing the development of a mathematical model of heat and mass transfer within a plant shoot, surrounded by air partially saturated with water vapour, with a soil boundary below. We include modelling ideas from recent studies [23,33] for the plant interior, and present an extended model that also considers the plant exterior, applied to a plant shoot similar to the Arabidopsis plants discussed in Crawford et al. [2]. Our model does not attempt to describe the dynamics of the plant growth, hence it is assumed that the plant boundaries do not change over time. Nor does it attempt to model the fine structure of water movement in the plant, but rather a representative macroscopic flow, through a porous medium. For the sake of simplicity, we consider a two-dimensional cross section through the plant, as illustrated schematically in figure 2.
Figure 2.
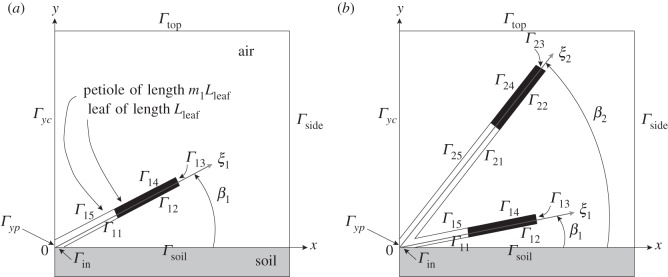
Schematic diagram of model geometry, illustrating the computational domain with boundary portions: (a) single leaf and petiole, emanating from the origin, (b) two leaves and petioles.
2.1. Governing equations
The so-called transpirational pull is the driving mechanism for water flow through the plant. We model the xylem flow as liquid water flow through a porous medium, to take (some) account of the complicated structure of the plant's medium for water transport. Thus, in the plant, we have momentum conservation given by Darcy's law, together with mass and energy conservation. Darcy's law gives the Darcy velocity (volumetric flow rate per unit area) ul(x, t) at position x and time t as
| 2.1 |
where  is the hydraulic conductance of the porous medium, ρl is the liquid water density, p is the liquid water pressure and g is the gravity vector. We note here that various definitions (and hence various units) for hydraulic conductivity and conductance are given throughout the literature; here, we follow the terminology of Chuang et al. [23]. Conservation of mass in our two-dimensional plant geometry, assuming there are no water sources or sinks within the plant itself, implies that
| 2.2 |
where s(x, t) is the liquid water volume fraction (saturation) relative to porosity and ϕ is the porosity of the plant. Here, η(x) is half the leaf width (perpendicular to the page in figure 2, giving upper and lower leaf surfaces of non-zero area) at position x. Thus, equation (2.2) represents conservation of liquid water mass in the petiole and leaf, while capturing the effect of leaf width. A similar argument is presented by Chuang et al. [23], where a one-dimensional model for flow in a tree was modified to include a variable term to account for trunk area variation. We note that leaf width is not a function of time in our model, so that (2.2) may be replaced by
| 2.3 |
Throughout the petioles, the cross-sectional area normal to the flow (and thus the width normal to the page) is assumed constant.
The pressure p and conductance  are functions of the liquid saturation s. Expressions for these functions may be derived from empirical relations for water potential, and xylem hydraulic quantities taken from studies of plants and soils. First, the relationship between pressure and saturation typically comes from an empirical relation that fits to a water retention curve. We follow Chuang et al. [23] and use the form
| 2.4 |
for some constants np and p0, where p = 0 and s = s0 at the inlet (the junction of the petioles and the soil). Thus
| 2.5 |
and
| 2.6 |
The hydraulic function  is typically fitted to a vulnerability curve, which gives percentage loss of conductivity as a function of water pressure. Here, we use a simple decreasing function of water pressure over appropriate pressure range. Again, we follow Chuang et al. [23], taking
| 2.7 |
where α is a constant, and p(s) is defined in equation (2.5). Then, the Darcy velocity (2.1) can be alternatively written as a function of s:
 |
2.8 |
Then, the mass equation (2.3) becomes
| 2.9 |
The temperature T(x, t) within the plant is governed by the modified heat equation:
| 2.10 |
as there is no heat source or sink within the plant, and convection effects are small. Here,  is the product of the specific heat capacity and mass density of the material, and
  is the thermal conductivity. While temperature effects are important, we shall take the ambient air temperature to be constant and uniform (to model the controlled environment in Crawford et al. [2]). As such, we take the air temperature simply as T(x, t) = T∞, while retaining temperature variation in the plant. We will use heat and mass transfer coefficients in boundary conditions to describe the air–plant balances, which we describe in more detail below.
We retain the variation of water vapour concentration C(x, t) in the air, however, as the water vapour pressure deficit is key in driving the evaporation from stomata at the leaf surface. In the absence of a prevailing wind, the mechanism for water vapour transport in air is diffusion, so the water vapour concentration is governed by
| 2.11 |
where D is the diffusion coefficient for water vapour in air. This still-air assumption models our controlled experimental conditions [2]; extending the model so that it is valid in ‘natural’ conditions would necessitate coupling (a possibly turbulent) air flow to the plant model. While important, this would require significant additional experimental data to properly parametrize, and is thus beyond the scope of our initial study and deferred to future work.
Thus, to summarize, the system states are liquid water saturation s(x, t) and temperature T(x, t) in the plant, and water vapour concentration C(x, t) in the air, governed by the parabolic equations (2.9), (2.10) and (2.11), respectively. We now proceed to describe the computational domain and boundary conditions.
2.2. Petiole/leaf geometry
2.2.1. Computational domain
In order to assess the effects on leaf cooling and water use of plant architectural parameters that describe elongation and elevation, we consider two plant-geometry configurations, with either one or two petiole/leaves, illustrated schematically in figure 2.
For the single-leaf configuration (figure 2a), we look sideways-on at a single leaf, whose petiole emanates from the origin O at the surface of the soil (from where the petiole's water is supplied), at an angle β1 to the soil surface (y = 0). The petiole and leaf have a thickness dpet, and we approximate experimentally observed architectures [2] by setting equal the angles of the leaf and petiole to y = 0. We define a leaf centreline axial coordinate ξ1 as shown in figure 2a. The leaf (shaded black in figure 2a) has length Lleaf, and its petiole has length m1Lleaf. The governing equations for s and T are solved in the leaf and petiole, which occupy the region bounded by the boundary portions Γin,1k,yp for k = 1, 2, … , 5, where Γ12,13,14 are leaf boundaries and Γin,11,15,yp are petiole boundaries. The governing equation for C in the surrounding air is solved in the region bounded by the boundary portions Γsoil,side,top,yc,1k, k = 5, 4, … , 1. To study the effects of temperature-mediated architectural adaptations affecting soil–leaf and leaf–leaf separation in a multi-leaf plant, we will use the corresponding two-leaf computational domain shown in figure 2b. The coordinates of the boundary vertices are computed under the assumption that the intersection point between the two petioles is at an angle (β1 + β2)/2 to the soil surface.
In both one- and two-leaf models, we assume symmetry about x = 0 and compute the solutions for a ‘half-plant’ contained within a rectangular air domain (so that figure 2a represents half of a two-leaf plant and figure 2b represents half of a four-leaf plant).
2.2.2. Boundary conditions
In the plant, we have parabolic equations for s and T, whereas in the air, we have a parabolic equation for C. At each plant–air boundary, we therefore require three boundary conditions. We do not solve the problem of heat and mass transfer within the soil, and so at plant–soil and air–soil boundaries, we require two conditions and one condition, respectively. The typical conditions used for our computations on each boundary portion are detailed in table 1. At the ‘inlet’ boundary Γin, water mass flux and heat flux into the petiole must balance those from the roots. However, without the detail of a root model, we take simple Dirichlet conditions of high water saturation s0 and fixed temperature Ti to represent the well-watered and high soil/petiole temperature conditions of Crawford et al. [2].
Table 1.
Boundary conditions for the computational model; n is the unit normal to the relevant surface, ∂/∂n the normal derivative.
| boundary | condition(s) | notes |
|---|---|---|
| Γyp | ∂s/∂n = 0 | symmetry |
| ∂T/∂n = 0 | symmetry | |
| Γyc | ∂C/∂n = 0 | symmetry |
| Γtop,side | C = C∞ | controlled environment |
| Γsoil | D∂C/∂n = qsoil(Csat(T) − C) | water vapour flux due to evaporation from soil surface |
| Γin | s = s0 | ‘inlet’ saturation given for well-watered condition |
| T = Ti | ‘inlet’ temperature, which will be high for covered soil | |
| Γ11,13,14,15, Γ21,23,24,25 | ul · n = 0 | zero normal liquid flux |
| −K̂∂T/∂n = hplant/air(T∞ −T) | heat balance | |
| ∂C/∂n = 0 | zero normal vapour flux | |
| Γ12,22 | (ρlul) · n = E | liquid flux to evaporation site |
| −K̂∂T/∂n = hplant/air(T∞ −T) + hvapE | heat balance with evaporation | |
| D∂C/∂n = (1/M)E | vapour flux driven by evaporation |
The ‘transpiration rate’ E is a function of the vapour pressure (or concentration) deficit. In Beguerisse et al. [33], the form taken was
| 2.12 |
where Csat is the saturation concentration and C is the water vapour concentration in the surrounding air. The Penman–Monteith equation [31,32,34] gives an expression for transpiration rate (mass flux) for models where water evaporation and exit from leaves via stomata is driven by vapour pressure deficit. There are many modifications and versions of the Penman–Monteith equation in use in the literature. Following Taiz & Zeiger [8], we take the simple form
| 2.13 |
Here, the constant gw is a measure of conductance, which depends on the resistance of the stomata and air to water mass transfer,  and psat(Ts) are the relative humidity and saturation vapour pressure functions (where the temperature Ts is that of the leaf surface, which we compute from our solution to the (s, T)-problem in the plant), and pa is the water vapour pressure. The Kelvin equation gives [35]
| 2.14 |
where M is the molar mass of water, and R is the universal gas constant.
With constant gw, (2.13) represents a simplified model of transpiration. In reality, the transpirational conductance will be a function of stomatal conductance, which is in turn a function of environmental conditions and water supply to the stomata. Similar models to (2.13), with transpiration rate proportional to vapour pressure deficit, have been presented by a number of authors, with much focus on the functional dependence of conductance on key plant and environmental variables [35–40]. These include a vast number of differing and complex empirical and mechanistic models at leaf or stomatal scale, many of which are yet to be tested experimentally. In the absence of further experimental data for Arabidopsis with which to parametrize complex and speculative models, we choose a simple conductance function that captures the effect of varying total open stomatal area. The key observation that stomatal opening (and hence conductance) is reduced in low water supply conditions with respect to well-watered conditions [36,37,40] is thus modelled here by including factors of liquid saturation s and stomatal density λ into our conductance function. A simple such representation of the water conductance incorporates linear dependence on s and λ, and our final transpiration rate is given by
| 2.15 |
(whereby evaporation is precluded as water supply or stomatal open area vanishes). Arabidopsis leaves have significantly more stomata on the lower (abaxial) surface than the upper (adaxial) [9], and we follow Crawford et al. [2] by considering stomata (and hence transpiration) only at the lower leaf surface.
For computations with uncovered soil, the mass flux from the soil is given by a concentration-deficit expression of the forms shown in references [41–44]:
| 2.16 |
for a mass transfer coefficient qsoil. In Crawford et al. [2], experiments are performed with the soil surface covered in cling-film, to ensure that measured water loss is from the plant rather than from the soil. In our numerical computations, we will simulate such conditions by taking qsoil = 0.
2.2.3. Leaf geometry
We must also specify the leaf width, as a function of the leaf/petiole axial coordinate ξ. The leaf half-width η (distance from leaf axis to leaf boundary normal to the page in figure 2) varies with the leaf axial coordinate  , increasing from the radius of the petiole at the junction with the petiole (
 ), up to a maximum, then down to zero at the leaf tip (
 ). To give a leaf-blade shape similar to those shown in photographs in Crawford et al. [2], our leaf half-width η is modelled using the function
 |
2.17 |
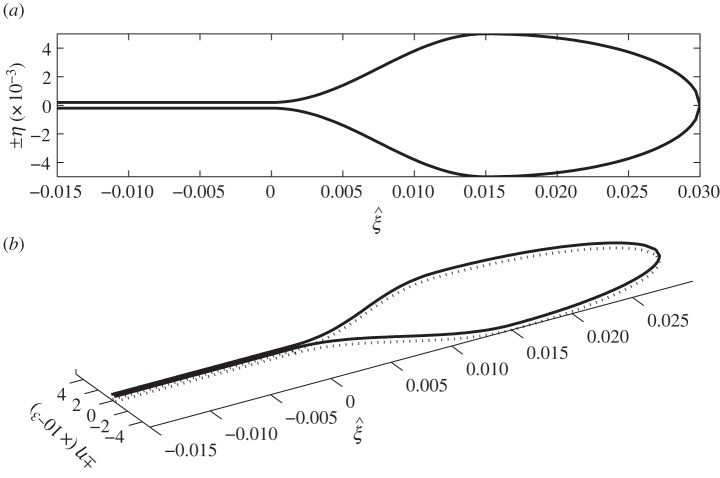
where Lleaf is the leaf length, r = dpet is the petiole radius and ηmax is half the maximum leaf width. A leaf outline can be constructed by plotting (ξ, ±η(ξ)), as in figure 3.
Figure 3.
(a) Proposed leaf geometry, taking Lleaf = 0.03 m, r = 0.0004 m and ηmax = 0.02 m. In (b), the dotted line represents the lower leaf surface.
2.3. Parameter values
Base parameter values used in our computations are listed in table 2. Estimates for leaf and petiole properties have been taken from published values where possible. Leaf length and width have been chosen to agree with the leaf area data in Crawford et al. [2]. The transpiration conductance-conductivity function gw and maximum hydraulic conductance  were manually fitted so that simulations showed order-of-magnitude agreement with the values reported in Crawford et al. [2] for temperature difference between compact and elongated plants (approx. 1°C) and the average water loss rate per leaf (approx. 10−8 kg s–1 per leaf). Note that we find a value for
  of the same order of magnitude as [23], though this is admittedly for a different plant.
Table 2.
Nomenclature and base parameter values used in simulations.
| symbol | description | value | units | source/notes |
|---|---|---|---|---|
| C | water vapour concentration | mol m–3 | ||
| s | liquid water saturation | — | ||
| T | plant temperature | °C | ||
| p | water pressure | Pa | ||
| pa | vapour pressure | Pa | ||
| ul | Darcy velocity | m s–1 | ||
| Ψ | total water potential | Pa | ||
| η | leaf half-width function | m | ||
| E | transpiration rate (mass flux) | kg m–2 s–1 | ||
| W | water loss | kg | ||
| psat(T) | saturation pressure function | 0.068105T3 + 0.1145T2 + 56.920T + 594.95 | Pa | cubic fit to saturation pressure data for 0 to 45°C [8] |
| t | time | s | ||
| th | time | h | ||
| g | acceleration due to gravity | 9.8 | m s–2 | |
| ϕ | porosity of leaf/stem | 0.5 | — | |
| ρl | density of liquid water | 1000 | kg m–3 | |

|
density–heat capacity product for leaf/petiole | 2 × 10⁵ | J K–1 m–3 | |
| T∞ | ambient air temperature | 20–40 | °C | for comparison with Crawford et al. [2] |
 |
maximum xylem hydraulic conductance | 10−7 | s | manually fitted to give temperature variations and water loss of order of magnitude reported in Crawford et al. [2]. Note, [23] has 5 × 10⁻⁸ for different plant |
| α | fitting parameter for vulnerability curve | 1 | Pa–1 | |

|
thermal conductivity of partially saturated leaf | 0.1 | W m–1 K–1 | all leaves in Hays [45] of order of 0.1 |
| D | diffusion coefficient of water vapour in air | 2.5 × 10⁻⁵ | m2 s–1 | average value taken from Beguerisse et al. [33] for T = 20−30°C |
| gw | transpiration capacitance-conductivity function | 3 × 10⁻⁵ | m–1 s | manually fitted to give temperature variations and water loss of order of magnitude reported in Crawford et al. [2] |
| cl | specific heat of liquid water | 103 | J kg–1 K–1 | |
| p0 | reference pressure for water retention fitting | Pa | for leaf water potentials of order of 1 MPa [8,46] | |
| np | index parameter for water retention fitting | 1 | — | |
| hplant/air | heat transfer coefficient (plant–air) | 10 | W m–2 K–1 | average for leaves studied in Linacre [47] |
| M | molar mass of water | 1.8 × 10⁻² | kg mol–1 | [33] |
| R | universal gas constant | 8.31 | J mol–1 K–1 | [33] |
| λ | open stomata area fraction | 0.024 | — | estimated from data in Crawford et al. [2] |
| Lleaf | leaf axial length | 0.03 | m | of order of largest leaves in Crawford et al. [2] |
| ηmax | half maximum leaf width | 0.01 | m | of order of largest leaves in Crawford et al. [2] |
| r | petiole radius and leaf thickness | 0.0004 | m | of order of leaf thickness in Crawford et al. [2] |
| qsoil | soil surface–air mass transfer coefficient | 0 | m s–1 | |
| C∞ | vapour concentration at boundary | 0.5 
|
mol m−3 | growth cabinet humidity of the order of 50% |
| m1,2 | ratio of petiole to leaf length | — | ||
| β1,2 | petiole angle to soil surface | ° |
2.4. Summary
In order to assess the effect of high-temperature-mediated adaptations in petiole elevation and elongation on plant cooling capacity, we will compute numerical solutions to the coupled problems of heat and mass transfer in the plant and water vapour diffusion in the surrounding air. Specifically, we compute solutions for (s,T) in the plant (equations (2.3) and (2.10)) simultaneously with C in the surrounding air (equation (2.11)), summarized below:
 |
2.18 |
Motivated by experimental observations [2], we will use the model to investigate the effect of varying petiole elevation and elongation; this architectural variation will be achieved by varying parameters m1,2 (petiole elongations) and β1,2 (angles of elevation).
3. Computational methods
We consider the experiments described in Crawford et al. [2], where plants grown at either 22°C or 28°C (which results in ‘compact’ or ‘elongated/elevated’ architectural phenotypes) are first cooled to a temperature of 20°C and then exposed to either a warm or hot environment (22°C or 28°C ambient temperature, respectively). We mimic this experiment computationally by prescribing values of m1,2 and β1,2 in both the single-leaf and two-leaf configurations to represent a range of compact and elongated/elevated plants. With these prescribed architectural geometries specified, we solve the governing equations from an initial condition with s, T, C uniform throughout their respective domains, with an ambient temperature T∞ = 20°C, until a steady state is achieved. The ambient temperature is then increased at time t = 0 (with a controlled humidity in the growth chamber), and we compute the temperature, saturation, concentration and water loss for each leaf over a 24 h time interval.
For each prescribed plant geometry, the solutions s, T, C (and quantities derived from these) are computed using the finite-element package Comsol v. 3.4 (http://www.comsol.com/products/news/3.4/). In order to generate a range of plant geometries, we use Comsol script to loop over m and β values. Careful tracking of the boundary indices is necessary when implementing the numerical solution in this manner, to ensure correct boundary conditions are applied on each portion of the boundary.
The system is run until steady-state temperature is achieved in a 20°C environment, results from which are then used as initial conditions for a 28°C environment. The 28°C computation is run until time th = 24 h. A steady-state temperature is usually achieved on times of the order of 10–100 min, and water loss rate from the leaf appears not to vary on a time scale of hours to days, in agreement with time courses experimentally observed in Crawford et al. [2].
Principally, we are interested in the temperature of each leaf as a measure of cooling capacity for each experiment. Because the driving mechanism for cooling is transpiration, and the cumulative water loss from each plant is recorded in Crawford et al. [2], we also compute two integrals for each experiment: the total rate of water loss, or transpiration rate (kg s–1) from the lower surface of leaf i at time t, given by
| 3.1 |
and the cumulative water loss Wi (kg) from leaf i up to time t, given by
| 3.2 |
The total cumulative water loss from the plant is given by  .
.
4. Results
Here, we describe the results of numerical simulations obtained for computations using a range of plant geometries. We keep the leaf length, breadth and depth fixed throughout, and instead focus on varying petiole length and angle as the key architectural parameters (to mimic experimentally observed phenotypes [2]). We begin with analysis of the ‘single-leaf’ problem, which refers to the computational domain in figure 2a; the solution, in this case, is representative of half a plant shoot with two petioles and leaves, given the symmetric boundary conditions at x = 0. This single-leaf analysis studies the important effect of separation of leaf from soil surface. We then progress to study a ‘two-leaf’ model (representative of half a plant shoot with four petioles and leaves), which also encompasses inter-leaf separation. In both cases, we study the effects of changing plant architecture by varying the elevation β1,2 and length m1,2 parameters of the petiole. We then go on to explore the effect of changing various environmental conditions, specifically air temperature and water supply.
4.1. Single-leaf analysis
4.1.1. Leaf separation from soil surface
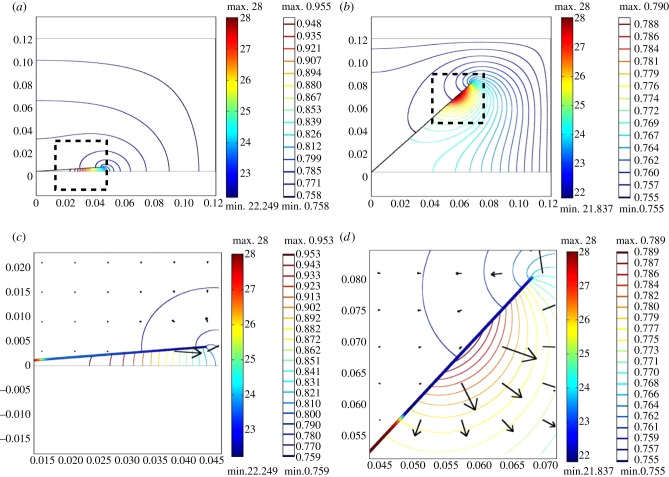
First, in figure 4, we show numerical simulation results for one compact (m1 = 0.5, β1 = 5°), and one very hyponastic, elongated (m1 = 2.5, β1 = 50°) architecture, chosen to estimate conditions seen experimentally [1,2]. From the temperature heat map within the petiole/leaf and the vapour concentration contours in the surrounding air, we clearly see the greater accumulation of water vapour between the covered soil surface and the compact plant's leaf, and a warmer leaf.
Figure 4.
Single leaf, varying architecture: temperature within leaf (°C; filled heat map, left-hand scale bar) and water vapour concentration (mol m–3; colour contours, right-hand scale bar) in surrounding air, with saturation s variable throughout the petiole and leaf. Arrows indicate water vapour flux. Axis scales are in metres. (a) Compact plant with m1 = 0.5, β1 = 5°. (b) Very hyponastic elongated plant with m1 = 2.5, β1 = 50°. (c) Detail of (a). (d) Detail of (b).
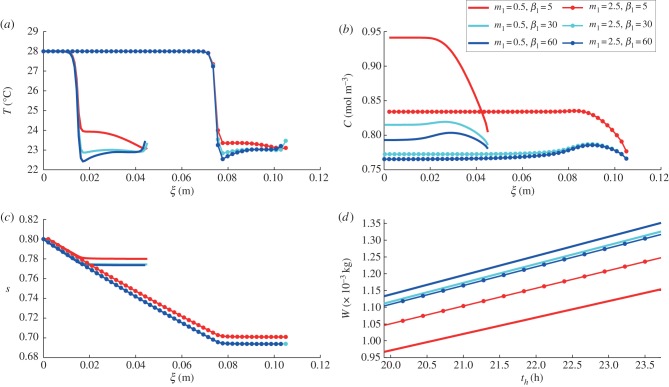
We further investigate and quantify this effect by computing temperature and saturation profiles within the leaf and vapour concentration profiles underneath the leaf at time th = 24 h, as shown in figure 5, for a range of petiole elevations and elongations. In each case, a sharp decrease in temperature occurs over a region close to the petiole–leaf junction, and the temperature profile has an inflection near the centre of the leaf. The temperature within the leaf increases slightly towards the leaf endpoint (as ξ → (m1 + 1)Lleaf in our model), owing to the evaporation rate vanishing at this point as the leaf width is 2η → 0. For plants with short petioles (m1 = 0.5, illustrated by solid lines in figure 5), we see that away from the leaf endpoint, an increase in elevation β1 generally results in lower temperature. This effect is not as significant for the plant with longer petiole (m1 = 2.5, illustrated by thinner lines with markers in figure 5). Furthermore, while increasing the petiole length for the β1 = 5° plant results in a lower leaf midpoint temperature, this enhanced cooling is not seen for the β1 = 30°, and a slight increase in leaf midpoint temperature even occurs upon lengthening the β1 = 60° plant. Each plant has almost linear water saturation (s) profile through its petiole, with an almost constant water content throughout its leaf. The elongated plants have lower water content s throughout their leaves. In a plant with high β1, this results in a lower water loss rate. However, for the plants with β1 = 5°, where the small soil–leaf separation results in higher vapour concentrations and lower transpiration rate, lengthening the petiole enhances the cooling capacity.
Figure 5.
Single leaf, varying architecture: (a) temperature T, (b) water vapour concentration C and (c) liquid saturation s profiles (as functions of leaf/petiole axial coordinate ξ) at steady state for a single leaf after introduction to 28°C environment, (d) with total water loss W time courses. Elongation and elevation are controlled by varying m1 and β1. Leaf length = 0.03 m, so for m1 = 0.5, the leaf–petiole junction is at ξ = 0.15, whereas for m1 = 2.5, the leaf–petiole junction is at ξ = 0.75.
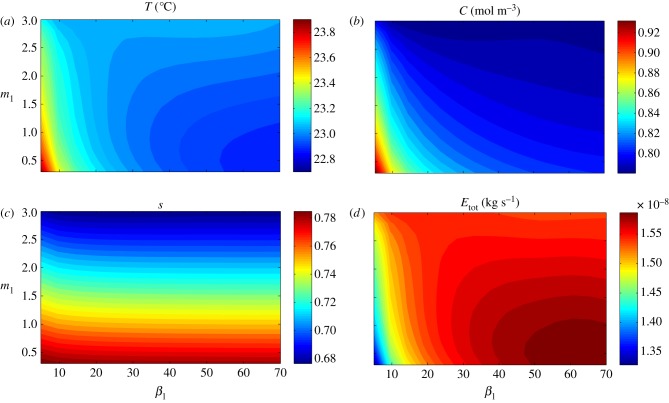
The earlier-discussed nonlinear effects are further demonstrated in figure 6, where we quantify the effect of varying the architectural parameters m1 and β1. Specifically, we show steady-state (at 24 h) values for temperature T and saturation s at the centre point of the leaf, water vapour concentration C in the air just below the leaf midpoint, and the transpiration rate (rate of water loss) Etot from the entire leaf, all as functions of m1 and β1. Focusing first on the temperature plot (figure 6a), we see that for small angles ( 25°), the leaf temperature decreases with increases in m1 and β1, that is, to architectural adaptations which increase the leaf's distance from the soil surface (in these computations, there is no zero vapour flux from the soil surface, to mimic the covered-soil experiments in Crawford et al. [2]). For fixed
  25°, we see the temperature is non-monotonic with respect to m1; T decreases with m1 to a minimum, then increases for longer petioles. This optimum petiole length for a given elevation represents a plant geometry for which further elevation alone enhances cooling by increasing separation from the soil surface, but enhanced cooling by further elongation alone is not achievable due to a decreased water supply. The contour plot for s (figure 6c) clearly shows the decreased water content with elongation. Furthermore, with our chosen parameter values, the model can predict temperature differences between the different phenotypes of the order of 1°C, and water loss rates of the order of 10−8 kg s−1, in agreement with the orders of magnitude reported in Crawford et al. [2].
Figure 6.
Single leaf, covered soil: the effect of architectural parameters β1 (petiole angle in degrees) and m1 (petiole to leaf length ratio) on leaf (a) temperature T, (b) water vapour concentration C, (c) saturation s and (d) total transpiration rate Etot, at steady state (time th = 24 h), after introduction to T = 28°C environment.
4.1.2. Leaf separation from soil surface, with water vapour flux from soil surface
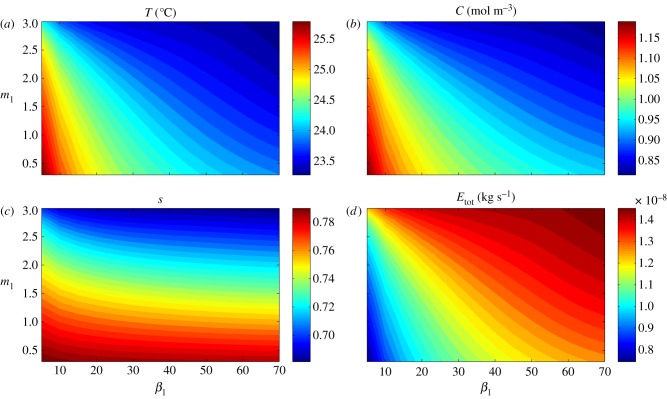
Our model predicts an increased cooling capacity resulting from leaf separation from the covered-soil surface, competing with a possible decreased cooling capacity with decreased leaf water content resulting from petiole elongation. The benefit in separating the leaf from the soil surface should increase under ‘natural’ conditions where the soil surface is uncovered and is itself, therefore, a source of water vapour, rather than the covered-soil surface experimental conditions studied in Crawford et al. [2]. In figure 7, we show the results of computations corresponding to those in figure 6, but now with qsoil > 0, to simulate uncovered soil providing a water vapour flux into the air. This flux increases the water vapour concentration in the air surrounding the plant, which acts to decrease the transpiration rate, and increase leaf temperature. With a vapour source from the soil, there is now much greater benefit in separating the leaf from the surface, which even outweighs the detrimental effect of elongation on water supply. In this case, both elevation and elongation always act to increase cooling, with T, C, s and Etot seen to be monotonic functions of both m1 and β1. We also see quantitative changes: transpiration drops significantly for compact plants, despite only a relatively small fall in liquid saturation in the plant.
Figure 7.
Single leaf, uncovered soil: the effect of architectural parameters β1 (petiole angle in degrees) and m1 (petiole to leaf length ratio) on leaf (a) temperature T, (b) water vapour concentration C, (c) saturation s and (d) total transpiration rate Etot, at steady state (time th = 24 h), after introduction to T = 28°C environment. Here, we mimic the natural environment by ‘uncovering’ the soil to allow a water vapour flux from the soil surface.
4.2. Two-leaf analysis
In a move towards more realistic multi-leaf plant geometries, we now consider a computational domain containing two leaves (corresponding to a symmetric four-leaf plant). Here, the parameters m1,2 and β1,2 control leaf–soil and inter-leaf separation, specifically denoting the elongation and elevation of the two leaves/petioles (where subscripts 1 and 2 refer to the lower and upper leaves, respectively), and we again analyse the effects of these parameters on leaf temperature. In addition to full variation of m1,2 and β1,2, we will also consider three specific plant geometries in more detail:
— a compact (COMP) plant (m1, β1) = (0.5, 5°), (m2, β2) = (0.8, 10°);
— a hyponastic elongated (HEL) plant (m1, β1) = (0.7, 15°), (m2, β2) = (1.2, 30°); and
— a very hyponastic elongated (VHEL) plant (m1, β1) = (1, 20°), (m2, β2) = (3.5, 50°).
4.2.1. Temperature and concentration fields for varying architecture
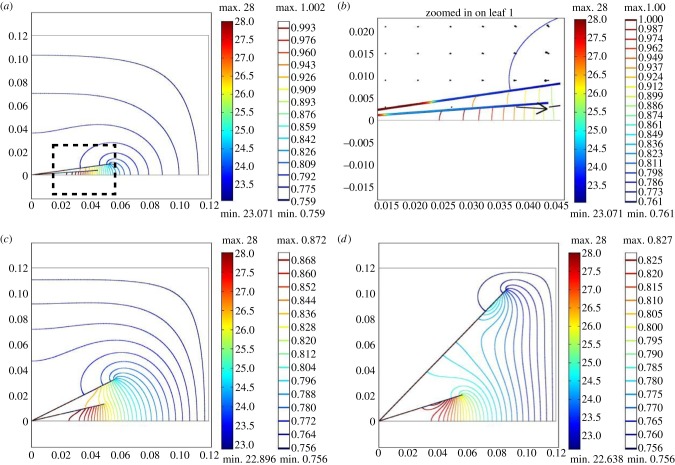
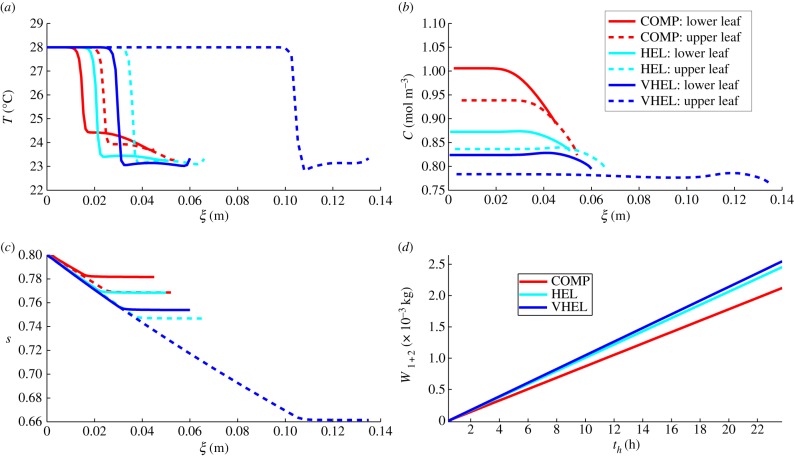
In figure 8, we show the steady-state temperature and concentration fields for our three two-leaf configurations, after 24 h in a 28°C experiment. The effects of simultaneously increasing both elevation (hyponasty) and elongation are clear: the more compact the plant, the higher the water vapour concentration at the lower leaf surfaces and the higher the leaf temperatures. In figure 8b, we zoom in on the lower leaf of the compact plant and see that the temperature is lower in the upper leaf, which is further from the covered-soil surface and has a lower vapour concentration at its underside. For a more detailed picture of variation in response to these two-leaf architectures, we show in figure 9 graphs of temperature, water vapour concentration and saturation profiles, together with water loss time courses. First, examining the temperature, we see that both leaves decrease their temperature in response to elongation/elevation. Further, the upper leaf of each plant is significantly cooler than the lower leaf, except for the VHEL plant. The reason for this again lies in the fact that the vapour concentration is lower at the upper leaf, leading to a higher transpiration rate, providing the water supply to the upper leaf is not significantly decreased. For the VHEL plant, despite the lower concentration C, the upper leaf has a significantly lower saturation s that limits the water supply.
Figure 8.
Two leaves, varying architecture: temperature within two leaves (°C; filled heat maps, left-hand scale bar) and water vapour concentration (mol m–3) in surrounding air (colour contours, right-hand scale bar). Axis scales are in metres. (a) Compact (COMP) plant. (b) Detail of compact (COMP) plant, lower leaf. Arrows indicate water vapour flux. (c) Hyponastic elongated (HEL) plant. (d) Very hyponastic elongated (VHEL) plant.
Figure 9.
Two leaves, varying architecture: graphs of (a) temperature T, (b) water vapour concentration C and (c) liquid saturation s profiles (as functions of leaf axial coordinates ξ1,2) at steady state for two-leaf plants in a 28°C environment, (d) with total water loss W1+2 (from both leaves) time courses. Plant architectures: compact (red), hyponastic elongated (cyan) and very hyponastic elongated (blue); upper leaf dashed lines.
4.2.2. Two-leaf plants with water vapour flux from soil
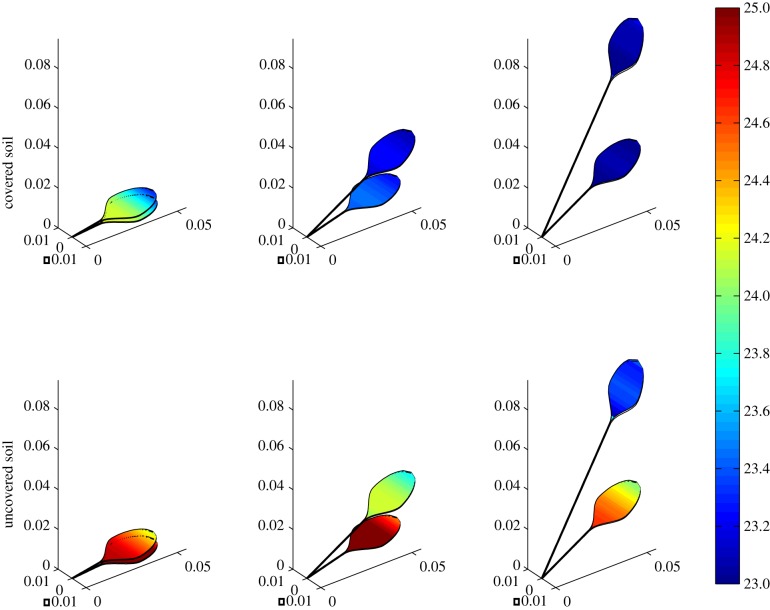
As in the single-leaf case, we can use our model to explore the effect on leaf temperature of uncovering the soil surface on two-leaf configurations. Figure 10 shows the leaf temperatures for three chosen geometries, comparing covered (qsoil = 0) and uncovered soil (qsoil = 10−4 m s−1). It is important to remember that our computational domain is two-dimensional, but here we choose a three-dimensional plot to visualize the temperature distribution throughout the leaves, allowing for a comparison with thermal images such as those shown in Crawford et al. [2]. The main effects are clear: the upper leaf is cooler (by temperature differences of the order of 1°C than the lower leaf), the elongated/elevated plants are cooler than compact ones and allowing water vapour flux from the soil surface limits the cooling capacity.
Figure 10.
Two leaves, covered versus uncovered soil: temperature (°C) heat maps imposed on leaf geometry, showing temperature distribution through leaves and petioles in three two-leaf plants. In the top row, there is no water vapour flux normal to the plane y = 0, as in the covered-soil experiments in Crawford et al. [2], whereas the bottom row simulates an uncovered soil. Axis scales are in metres.
4.2.3. Upper leaf separation from soil surface and lower leaf
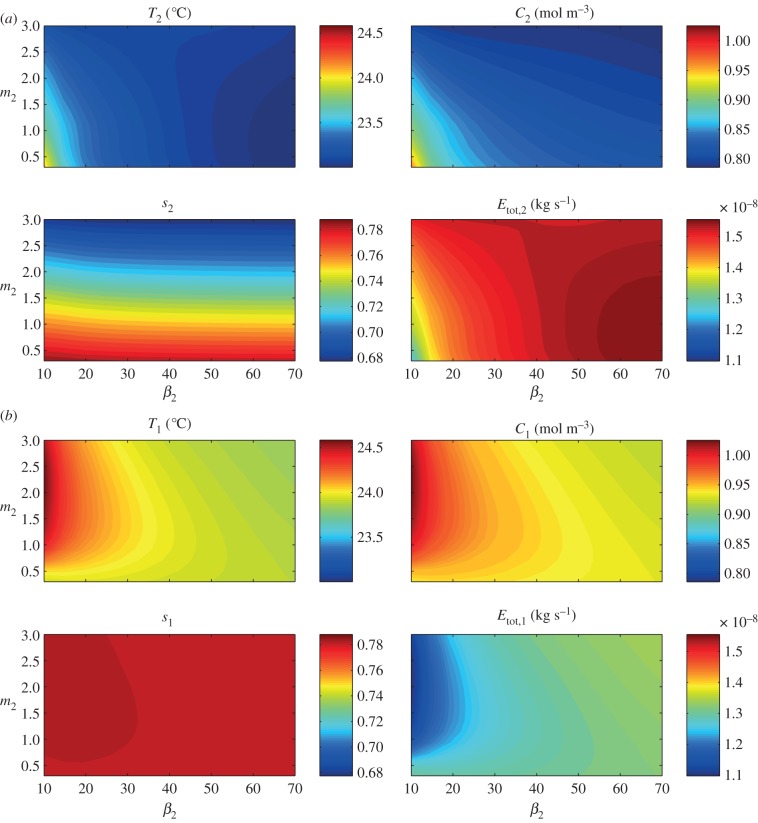
In order to explore more thoroughly the effect of architectural adaptation, we now consider continuous variation of upper leaf elevation β2 and petiole length (by varying m2), with a fixed lower leaf. In figures 11 and 12, we show steady-state (at 24 h) values for temperature, water vapour concentration, saturation and total transpiration rate, for both the upper and lower leaves (subscripts 2 and 1, respectively) as functions of m2, β2, with fixed β1 = 5° and m1 = 0.5. Figure 11 shows results of simulations which mimic those of Crawford et al. [2] by having the soil covered. For the upper leaf, we see a similar dependence on architecture as for the single-leaf problem. For angles  45°, the upper leaf temperature decreases with increased m2, whereas for greater (fixed) elevations, T2 is non-monotonic with respect to m2. This again corresponds to a decreased saturation s2 with elongation. The temperature heat map for the lower leaf shows a different effect. As m2 is increased from a very small value, the evaporation from the upper leaf contributes to an increased vapour concentration to which the lower leaf is exposed, thus reducing the lower leaf's transpiration rate and increasing its temperature T1. As m2 is further increased, the upper leaf is eventually far enough away from the lower leaf such that its contribution to water vapour build-up is lower, and its temperature T1 begins to decrease. Hence, we see, for each fixed β2, a maximum in the lower leaf temperature with respect to m2. The upper leaf is always cooler than the lower leaf, by up to approximately 1°C.
Figure 11.
Two leaves, covered soil: effect of architectural parameters β2 (upper leaf petiole angle in degrees) and m2 (upper petiole to leaf length ratio; with fixed β1 = 5° and m1 = 0.5) on leaf temperature T1,2, water vapour concentration C1,2, saturation s1,2 and total transpiration rate Etot,1,2 at steady state, after introduction to 28°C environment. (a) Upper leaf (leaf 2). (b) Lower leaf (leaf 1).
Figure 12.
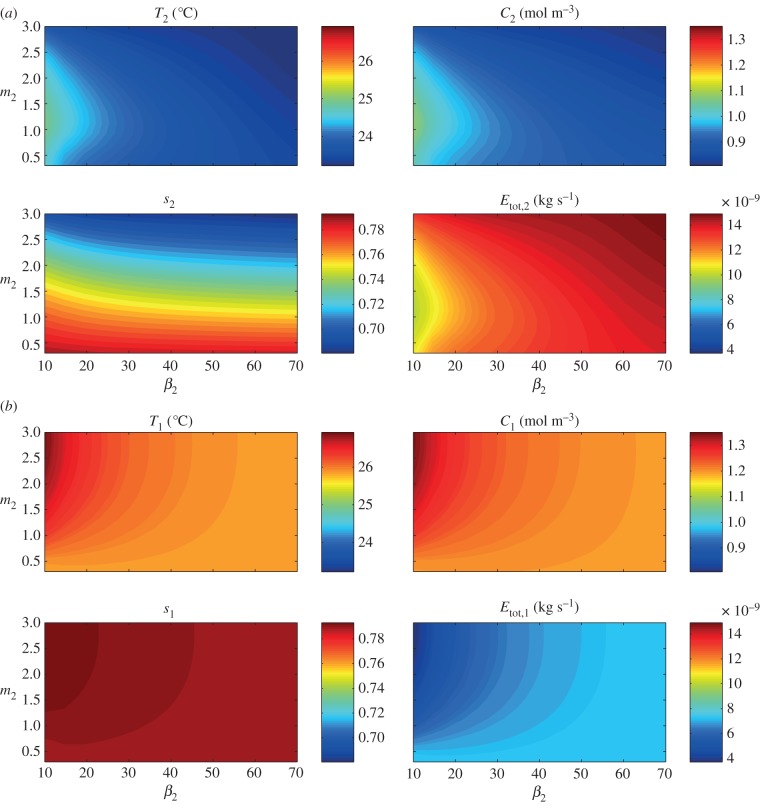
Two leaves, uncovered soil: effect of architectural parameters β2 (upper leaf petiole angle in degrees) and m2 (upper petiole to leaf length ratio; with fixed β1 = 5° and m1 = 0.5) on leaf temperature T1,2, water vapour concentration C1,2, saturation s1,2, and total transpiration rate Etot,1,2 at steady state, after introduction to 28°C environment. (a) Upper leaf (leaf 2). (b) Lower leaf (leaf 1).
The results for uncovered soil (qsoil = 10−4 m s−1), shown in figure 12, again reveal non-monotonicity of the upper leaf temperature T2 with respect to upper leaf elongation m2, but this time for smaller angles ( 45°). Here, the vapour concentration and transpiration rate initially increase with m2 as the upper leaf becomes less shielded by the lower leaf from the soil surface vapour source. For each
  45° there is a value of m2 for which the temperature reaches a maximum; elongation beyond this value then benefits cooling by increasing the distance from the vapour source at y = 0. Again, the lower leaf has a temperature of the order of 1°C higher than the upper leaf. This time, the lower leaf temperature T1 is monotonic increasing with upper leaf elongation m2, whereas a more distant upper leaf lessens the effect of vapour flux from upper leaf, the elongated petiole acts as a trap for the vapour rising from the soil surface and there is no maximum in water vapour concentration C1 (nor minimum in transpiration rate Etot,1) as m2 increases.
4.3. Varying environmental conditions
The majority of our simulations so far have mimicked the experiments in Crawford et al. [2], where Arabidopsis plants were grown in cabinets where ambient temperature and relative humidity were controlled and kept constant throughout the experiments. Our model can, of course, be modified in order to capture the effects of varying environmental input conditions, such as ambient temperature and water supply from the roots, and to generate experimentally testable predictions.
4.3.1. Effect of increasing ambient air temperature
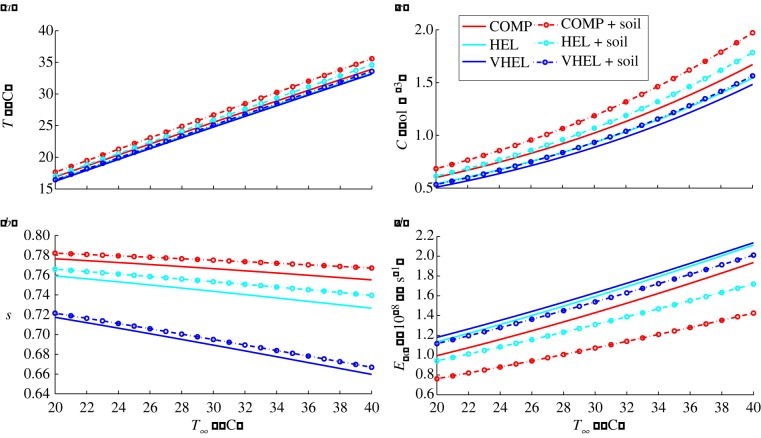
A demonstration of the effect of varying ambient air temperature T∞ in a range of different experiments, kept constant throughout each one, is shown in figure 13. Here, the upper leaf values for temperature, water vapour concentration, saturation and total transpiration are computed at steady state (after 24 h), after introducing a two-leaf plant into the T∞ environment. The four quantities are all monotonic functions of T∞, with increases in ambient temperature giving increases in temperature, water vapour concentration and total transpiration, together with decreased leaf water saturation. Note, however, that the model does not currently include any temperature dependence of parameters such as stomatal opening; such development in the model is an area for future work, informed by new experimental data.
Figure 13.
Two leaves, varying ambient temperature: effect on leaf (a) temperature T, (b) saturation s, (c) water vapour concentration C and (d) total transpiration rate Etot at steady state, after introduction to T = T∞ environment. Simulations shown for compact (COMP), hyponastic elongated (HEL) and very hyponastic elongated (VHEL) plants. Values shown are for centre of upper leaf, both with (dotted line with circles) and without (solid line) vapour flux from the soil surface.
4.3.2. Varying inlet water supply for a single-leaf configuration
The water uptake by the plant, modelled here by the inlet saturation s0, has been fixed for all simulations described in this paper so far. In reality, this will vary dynamically, and will be a function of variables including initial soil water content, ambient air temperature, and importantly the root architecture and water uptake mechanism. Coupling the above-ground (shoot) architecture to the root architecture requires additional model components for heat and mass transfer in the soil, root-water uptake and flow in the roots, which are beyond the scope of the present study; we refer the reader to Roose & Schnepf [12] for a discussion of plant–soil interaction models. However, we can make a preliminary assessment of the effects of factors controlling water supply to the petiole vertex simply by varying s0 in our current model. Previously, we have noted that elongating a petiole (increasing m1) can result in higher temperature owing to a lower leaf water saturation limiting the transpiration rate. In figure 14, we show centre-leaf temperature T as a function of both elongation and inlet saturation. While increasing elongation for a fixed inlet saturation results in a higher T, increasing saturation for fixed elongation decreases T. Thus, if varying growth conditions resulting in petiole elongation also result in an increased water availability at the petiole vertex (e.g. by adaptations in root architecture, or internal structure of the petiole), then decreased leaf temperature could be seen with increased elongation; one example of such a relationship between m1 and s0 is indicated in figure 14 by a black line.
Figure 14.
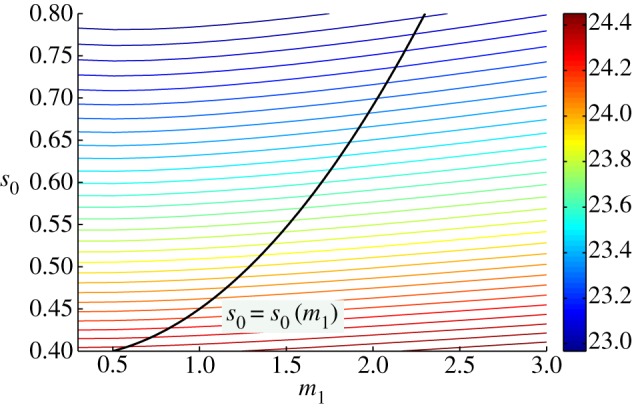
One leaf, varying petiole inlet saturation: temperature T1 at steady state in response to varying water supply at petiole vertex/inlet. With fixed s0, increasing m1 gives increased T1. However, increasing m1 (and also s0) along the curve in black gives reduced T1.
5. Discussion
In this paper, we have used mathematical modelling to address the hypothesis presented in recent work [2] that high-temperature-mediated shoot architectural adaptations observed in Arabidopsis could reflect a cooling strategy based on increasing leaf–soil and inter-leaf separation. In considering this hypothesis, we have developed a new model that couples heat and mass transfer within the plant's petioles and leaves, and the surrounding air. The model has allowed us to understand possible mechanisms by which a plant uses water to cool its leaves, by quantifying the effects of key architectural parameters on leaf temperature, water content, transpiration rate and water vapour concentration in the air. Our results support the hypothesis that high-temperature-adapted architectures enhance leaf cooling by sufficiently separating leaves, both from the soil surface and each other, in order to avoid a transpiration-restricting accumulation of water vapour in the air adjacent to the stomata on the underside of leaves. Increased leaf–leaf and soil–leaf separation achieved by increases in petiole length and angle generally result in lower vapour concentration adjacent to the leaf, increased transpiration rate and lower temperature. In covered-soil conditions (as in the experiments of Crawford et al. [2]), the varying water content of the leaf can serve to limit the transpiration rate in elongated configurations, leading to complex nonlinear dependence of leaf temperature on elevation and elongation. However, with sufficient vapour flux from the soil surface (unlike the covered-soil experiments of Crawford et al. [2]), our model predicts monotonic relationships, reflecting the increased benefit to cooling of separating the leaf from the soil surface. In summary, the key simulated response to elongation and elevation is a decrease in leaf temperature, as a result of increased transpiration rate (and thus enhanced evaporative cooling capacity) due to leaf separation.
Importantly, the results obtained from our mathematical model reproduced the qualitative trends shown in experimental data [2]. Furthermore, we obtain quantitative agreement with the orders of magnitude of water loss rates and temperature differences reported in Crawford et al. [2]. Given that our two-dimensional approximation can reproduce good agreement with data from an inherently three-dimensional process (in three dimensions, the water vapour diffusion path from below a petiole to above it is much shorter than in two dimensions), we are confident that further model development and extension to three dimensions will admit parametrizations that give even better agreement with experimental data.
The goal of this study was to assess the effect of key architectural parameters (petiole/leaf elevation and elongation here) on plant temperature control. Future work could include more extensive parameter sensitivity analysis, to better understand the role of heat transfer, hydraulic and stomatal coefficients in the model. Ideally, these would be combined with complementary parameter estimation studies as new data are generated, particularly using temperature and water loss time courses recorded at shorter time intervals, to allow insights into the dynamic behaviour of the system.
A significant feature of our mathematical model is that there is a feedback from the plant to the surrounding air provided by the transpirational flux, whereby the transpiration rate from the lower leaf stomata is a function of our key variables and a quantity that we solve for, rather than a prescribed model input as in Chuang et al. [23]. This coupling at the leaf–air boundaries represents an improvement over current models available in the literature. Moreover, the two-dimensional formulation and finite-element solution technique, with leaf-width consideration, establishes a platform upon which to build a more detailed model in two and three dimensions. Our model is the first of its type to couple the flow and heat transfer in the plant and its surroundings at plant shoot scale, and we suggest that it is a powerful ‘basic model’; the coupling is of fundamental importance, and each of the model components could now, with the aid of new experimental data, be modelled in greater detail. For example, the interior architecture of the leaves and petioles could be considered, along with structure of leaf vein networks [46], stomatal distribution patterns and root networks. Further extensions to bring the model closer to ‘natural’ conditions should also include plant–soil interactions [12], air movement and air temperature variability, stomatal function, the energetic costs of plant growth responses and radiation load on leaf surfaces.
Our current work thus appears to provide not only new insights into the significance of architectural adaptations in relation to plant cooling, but also provides a potential platform for bridging the gap between modelling of the soil–plant–atmosphere continuum (where the current state of the art lies in detailed models of water movement [23,36]) and leaf and stomatal-scale heat and gas balance models [35,37,38,40]. Water-use efficiency is a priority area in plant science research, particularly with regard to growth at elevated temperatures associated with global climate change [48,49]. The majority of research to date has focused on the intricate molecular mechanisms controlling root architecture [50], stomatal development [51] and stomatal aperture [52]. Our study, when combined with experimental data presented in Crawford et al. [2], suggests that shoot architecture significantly impacts on stomatal function in natural environments.
Much of the computational work here has been directed towards understanding, and finding agreement with, recent experimental results for Arabidopsis in well-watered conditions [2]. It is worth noting that the model and its constituent mechanisms are based on assumptions more widely applicable to other plants. Thus, our model possesses a valuable generality, and could be applied further to different species, in different environmental conditions. For example, our model could be used in tandem with laboratory experiments to investigate architectural effects on the cooling of crops (including multiple plants grown at varying densities), and also the trade-off between cooling and water conservation strategies in drought conditions.
We conclude that our timely mathematical study has resulted in three significant advances.
(1) Simulations which support previous suggestions that leaf separation and elevation from the soil surface facilitate plant cooling capacity [2].
(2) New insights into the interplay between shoot architecture, leaf cooling and water supply.
(3) The development of a basic model and computational technique that provide a forum and framework for wider systems biology investigations into the role of architecture in plant cooling and water use.
Acknowledgements
A problem of plant cooling was presented by K.A.F. at the Third Mathematics in the Plant Sciences Study Group, December 2009, at the University of Nottingham. The authors acknowledge valuable discussion with Prof. John King (University of Nottingham), and all authors of reference [33]. This work was supported by an EPSRC Institutional Sponsorship Award at the University of Bristol. K.A.F. is supported by a Royal Society University Research Fellowship.
Appendix A. The parameter values
Base parameter values for our model are given in table 2.
References
- 1.Koini MA, Alvey L, Allen T, Tilley CA, Harberd NP, Whitelam GC, Franklin KA. 2009. High temperature-mediated adaptations in plant architecture require the bHLH transcription factor PIF4. Curr. Biol. 19, 408–413 10.1016/j.cub.2009.01.046 (doi:10.1016/j.cub.2009.01.046) [DOI] [PubMed] [Google Scholar]
- 2.Crawford AJ, McLachlan DH, Hetherington AM, Franklin KA. 2012. High temperature exposure increases plant cooling capacity. Curr. Biol. 22, R396–R397 10.1016/j.cub.2012.03.044 (doi:10.1016/j.cub.2012.03.044) [DOI] [PubMed] [Google Scholar]
- 3.Gray WM, Östin A, Sandberg G, Romano CP, Estelle M. 1998. High temperature promotes auxin-mediated hypocotyl elongation in Arabidopsis. Proc. Natl Acad. Sci. USA 95, 7197–7202 10.1073/pnas.95.12.7197 (doi:10.1073/pnas.95.12.7197) [DOI] [PMC free article] [PubMed] [Google Scholar]
- 4.Stavang JA, Gallego-Bartolome J, Gomez M, Yoshida S, Asami T, Olsen JE, Garca-Martnez JL, Alabadi D, Blazquez MA. 2009. Hormonal regulation of temperature-induced growth in Arabidopsis. Plant J. 60, 589–601 10.1111/j.1365-313X.2009.03983.x (doi:10.1111/j.1365-313X.2009.03983.x) [DOI] [PubMed] [Google Scholar]
- 5.Franklin KA, et al. 2011. Phytochrome interacting factor 4 regulates auxin biosynthesis at high temperature. Proc. Natl Acad. Sci. USA 108, 20 231–20 235 10.1073/pnas.1110682108 (doi:10.1073/pnas.1110682108) [DOI] [PMC free article] [PubMed] [Google Scholar]
- 6.Buckley TN. 2005. The control of stomata by water balance. New Phytol. 168, 275–292 10.1111/j.1469-8137.2005.01543.x (doi:10.1111/j.1469-8137.2005.01543.x) [DOI] [PubMed] [Google Scholar]
- 7.Sirichandra C, Wasilewska A, Vlad F, Valon C, Leung J. 2009. The guard cell as a single-cell model towards understanding drought tolerance and abscisic acid action. J. Exp. Bot. 60, 1439–1463 10.1093/jxb/ern340 (doi:10.1093/jxb/ern340) [DOI] [PubMed] [Google Scholar]
- 8.Taiz L, Zeiger E. 2002. Plant physiology, 3rd edn. Cambridge, MA: Sinauer Associates [Google Scholar]
- 9.Hetherington AM, Woodward FI. 2003. The role of stomata in sensing and driving environmental change. Nature 424, 901–908 10.1038/nature01843 (doi:10.1038/nature01843) [DOI] [PubMed] [Google Scholar]
- 10.Van Zanten M, Voesenek LACJ, Peeters AJM, Millenaar FF. 2009. Hormone- and light-mediated regulation of heat-induced differential petiole growth in Arabidopsis. Plant Physiol. 151, 1446–1458 10.1104/pp.109.144386 (doi:10.1104/pp.109.144386) [DOI] [PMC free article] [PubMed] [Google Scholar]
- 11.Baptista FJ, Bailey BJ, Meneses JF. 2005. Measuring and modelling transpiration versus evapotranspiration of a tomato crop grown on soil in a Mediterranean greenhouse. Acta Horticulturae (ISHS) 691, 313–320 [Google Scholar]
- 12.Roose T, Schnepf A. 2008. Mathematical models of plant–soil interaction. Phil. Trans. R. Soc. A 366, 4597–4611 10.1098/rsta.2008.0198 (doi:10.1098/rsta.2008.0198) [DOI] [PubMed] [Google Scholar]
- 13.Rand RH. 1983. Fluid mechanics of green plants. Annu. Rev. Fluid Mech. 15, 29–45 10.1146/annurev.fl.15.010183.000333 (doi:10.1146/annurev.fl.15.010183.000333) [DOI] [Google Scholar]
- 14.Janott M, Gayler S, Gessler A, Javaux M, Klier C, Priesack E. 2011. A one-dimensional model of water flow in soil–plant systems based on plant architecture. Plant Soil 341, 233–256 10.1007/s11104-010-0639-0 (doi:10.1007/s11104-010-0639-0) [DOI] [Google Scholar]
- 15.Turner SR, Somerville CR. 1997. Collapsed xylem phenotype of Arabidopsis identifies mutants deficient in cellulose deposition in the secondary cell wall. Plant Cell 9, 689–701 10.1105/tpc.9.5.689 (doi:10.1105/tpc.9.5.689) [DOI] [PMC free article] [PubMed] [Google Scholar]
- 16.Bowman J. 1994. Arabidopsis: an atlas of morphology and development. New York, NY: Springer [Google Scholar]
- 17.Sack L, Streeter CM, Holbrook NM. 2004. Hydraulic analysis of water flow through leaves of sugarmaple and red oak. Plant Physiol. 134, 1824–1833 10.1104/pp.103.031203 (doi:10.1104/pp.103.031203) [DOI] [PMC free article] [PubMed] [Google Scholar]
- 18.Vilagrosa A, Chirino E, Peguero-Pina JJ, Barigah TS, Cochard H, Gil-Pelegrin E. 2012. Xylem cavitation and embolism in plants living in water-limited ecosystems. In Plant responses to drought stress (ed. Aroca R.), pp. 63–109 Berlin, Germany: Springer [Google Scholar]
- 19.Aumann AC, Ford ED. 2002. Modelling tree water flow as an unsaturated flow through a porous medium. J. Theor. Biol. 219, 415–429 10.1006/jtbi.2002.3061 (doi:10.1006/jtbi.2002.3061) [DOI] [PubMed] [Google Scholar]
- 20.Schulte JP, Costa DG. 1996. A mathematical description of water flow through plant tissues. J. Theor. Biol. 180, 61–70 10.1006/jtbi.1996.0078 (doi:10.1006/jtbi.1996.0078) [DOI] [Google Scholar]
- 21.Früh T, Kurth W. 1999. The hydraulic system of trees: theoretical framework and numerical simulation. J. Theor. Biol. 201, 251–270 10.1006/jtbi.1999.1028 (doi:10.1006/jtbi.1999.1028) [DOI] [PubMed] [Google Scholar]
- 22.Kumagai T. 2001. Modelling water transportation and storage in sapwood: model development and validation. Agric. Forest Meteorol. 109, 105–115 10.1016/S0168-1923(01)00261-1 (doi:10.1016/S0168-1923(01)00261-1) [DOI] [Google Scholar]
- 23.Chuang Y-L, Oren R, Bertozzi AL, Phillips N, Katul GG. 2006. The porous media model for the hydraulic system of a conifer tree: linking sap flux data to transpiration rate. Ecol. Mod. 191, 447–468 10.1016/j.ecolmodel.2005.03.027 (doi:10.1016/j.ecolmodel.2005.03.027) [DOI] [Google Scholar]
- 24.Bridge L, Bradean R, Ward MJ, Wetton BR. 2003. The analysis of a two-phase zone with condensation in a porous medium. J. Eng. Math. 45, 247–268 10.1023/A:1022690802938 (doi:10.1023/A:1022690802938) [DOI] [Google Scholar]
- 25.Bridge LJ, Wetton BR. 2007. A mixture formulation for numerical capturing of a two-phase/vapour interface in a porous medium. J. Comput. Phys. 225, 2043–2068 10.1016/j.jcp.2007.03.011 (doi:10.1016/j.jcp.2007.03.011) [DOI] [Google Scholar]
- 26.Liu W, Peng SW, Mizukami K. 1995. A general mathematical modelling for heat and mass transfer in unsaturated porous media: an application to free evaporative cooling. Heat Mass Transf. 31, 49–55 10.1007/BF02537421 (doi:10.1007/BF02537421) [DOI] [Google Scholar]
- 27.Mittal A, Kataria T, Das GK, Chatterjee SG. 2006. Evaporative cooling of water in a small vessel under varying ambient humidity. Int. J. Green Energy 3, 347–368 10.1080/01971520600704654 (doi:10.1080/01971520600704654) [DOI] [Google Scholar]
- 28.van der Sman MRG. 2003. Simple model for estimating heat and mass transfer in regular-shaped foods. J. Food Eng. 60, 383–390 10.1016/S0260-8774(03)00061-X (doi:10.1016/S0260-8774(03)00061-X) [DOI] [Google Scholar]
- 29.Younsi R, Kocaefe D, Kocaefe Y. 2006. Three-dimensional simulation of heat and moisture transfer in wood. Appl. Therm. Eng. 26, 1274–1285 10.1016/j.applthermaleng.2005.10.029 (doi:10.1016/j.applthermaleng.2005.10.029) [DOI] [Google Scholar]
- 30.Liu BC, Liu W, Peng SW. 2005. Study of heat and moisture transfer in soil with a dry surface layer. Int. J. Heat Mass Transf. 48, 4579–4589 10.1016/j.ijheatmasstransfer.2005.06.004 (doi:10.1016/j.ijheatmasstransfer.2005.06.004) [DOI] [Google Scholar]
- 31.Penman HL. 1948. Natural evaporation from open water, bare soil and grass. Proc. R. Soc. Lond. A 193, 120–145 10.1098/rspa.1948.0037 (doi:10.1098/rspa.1948.0037) [DOI] [PubMed] [Google Scholar]
- 32.Monteith JL. 1965. Evaporation and environment. Symp. Soc. Exp. Biol. 19, 205–224 [PubMed] [Google Scholar]
- 33.Beguerisse M, et al. 2010. Assessing the adaptive significance of plant architectural adaptations to elevated temperature. Mathematical Modelling in Plant Sciences Study Group report, Centre for Plant Integrative Biology, University of Nottingham, UK. See http://www.cpib.ac.uk/events/mpssg-2009/
- 34.Monteith JL. 1995. Accommodation between transpiring vegetation and the convective boundary layer. J. Hydrol. 166, 251–263 10.1016/0022-1694(94)05086-D (doi:10.1016/0022-1694(94)05086-D) [DOI] [Google Scholar]
- 35.Tuzet A, Perrier A, Leuning R. 2003. A coupled model of stomatal conductance, photosynthesis and transpiration. Plant Cell Environ. 26, 1097–1116 10.1046/j.1365-3040.2003.01035.x (doi:10.1046/j.1365-3040.2003.01035.x) [DOI] [Google Scholar]
- 36.Manzoni S, Vico G, Porporato A, Katul G. 2013. Biological constraints on water transport in the soil–plant–atmosphere system. Adv. Water Resour. 51, 292–304 10.1016/j.advwatres.2012.03.016 (doi:10.1016/j.advwatres.2012.03.016) [DOI] [Google Scholar]
- 37.Buckley TN, Mott KA, Farquhar GD. 2003. A hydromechanical and biochemical model of stomatal conductance. Plant Cell Environ. 26, 1767–1785 10.1046/j.1365-3040.2003.01094.x (doi:10.1046/j.1365-3040.2003.01094.x) [DOI] [Google Scholar]
- 38.Katul GB, Oren R, Manzoni S, Higgins C, Parlange MB. 2012. Evapotranspiration: a process driving mass transport and energy exchange in the soil–plant–atmosphere–climate system. Rev. Geophys. 50, RG3002. 10.1029/2011RG000366 (doi:10.1029/2011RG000366) [DOI] [Google Scholar]
- 39.Collatz GJ, Ball JT, Grivet C, Berry JA. 1991. Physiological and environmental regulation of stomatal conductance, photosynthesis and transpiration: a model that includes a laminar boundary layer. Agric. Forest Meteorol. 54, 107–136 10.1016/0168-1923(91)90002-8 (doi:10.1016/0168-1923(91)90002-8) [DOI] [Google Scholar]
- 40.Damour G, Simonneau T, Cochard H, Urban L. 2010. An overview of models of stomatal conductance at the leaf level. Plant Cell Environ. 33, 1419–1438 10.1111/j.1365-3040.2010.02181.x (doi:10.1111/j.1365-3040.2010.02181.x) [DOI] [PubMed] [Google Scholar]
- 41.Bittelli M, Ventura F, Campbell GS, Snyder RL, Gallegati F, Rossi P. 2008. Coupling of heat, water vapor, and liquid water fluxes to compute evaporation in bare soils. J. Hydrol. 362, 191–205 10.1016/j.jhydrol.2008.08.014 (doi:10.1016/j.jhydrol.2008.08.014) [DOI] [Google Scholar]
- 42.Desborough CE, Pitman AJ, Irannejad P. 1996. Analysis of the relationship between bare soil evaporation and soil moisture simulated by 13 land surface schemes for a simple non-vegetated site. Glob. Planet. Change 13, 47–56 10.1016/0921-8181(95)00036-4 (doi:10.1016/0921-8181(95)00036-4) [DOI] [Google Scholar]
- 43.Alven G, Jansson P-E. 1997. Model for evaporation, moisture and temperature of bare soil: calibration and sensitivity analysis. Agric. Forest Meteorol. 88, 47–56 10.1016/S0168-1923(97)00052-X (doi:10.1016/S0168-1923(97)00052-X) [DOI] [Google Scholar]
- 44.Grifoll G, Gasto JM, Cohen Y. 2005. Non-isothermal soil water transport and evaporation. Adv. Water Resour. 28, 1254–1266 10.1016/j.advwatres.2005.04.008 (doi:10.1016/j.advwatres.2005.04.008) [DOI] [Google Scholar]
- 45.Hays RL. 1975. The thermal conductivity of leaves. Planta (Berlin) 125, 281–287 10.1007/BF00385604 (doi:10.1007/BF00385604) [DOI] [PubMed] [Google Scholar]
- 46.Scoffoni C, Rawls M, McKown A, Cochard H, Sack L. 2011. Decline of leaf hydraulic conductance with dehydration: relationship to leaf size and venation architecture. Plant Physiol. 156, 832–843 10.1104/pp.111.173856 (doi:10.1104/pp.111.173856) [DOI] [PMC free article] [PubMed] [Google Scholar]
- 47.Linacre ET. 1964. Determinations of the heat transfer coefficient of a leaf. Plant Physiol. 39, 687–690 10.1104/pp.39.4.687 (doi:10.1104/pp.39.4.687) [DOI] [PMC free article] [PubMed] [Google Scholar]
- 48.Vile D, Pervent M, Belluau M, Vasseur F, Bresson J, Muller B, Granier C, Simonneau T. 2012. Arabidopsis growth under prolonged high temperature and water deficit: independent or interactive effects? Plant Cell Environ. 35, 702–718 10.1111/j.1365-3040.2011.02445.x (doi:10.1111/j.1365-3040.2011.02445.x) [DOI] [PubMed] [Google Scholar]
- 49.Battisti DS, Naylor RL. 2009. Historical warnings of future food insecurity with unprecedented seasonal heat. Science 323, 240–244 10.1126/science.1164363 (doi:10.1126/science.1164363) [DOI] [PubMed] [Google Scholar]
- 50.Overvoorde P, Fukaki H, Beeckman T. 2010. Auxin control of root development. Cold Spring Harb. Perspect. Biol. 2, 1–16 10.1101/cshperspect.a001537 (doi:10.1101/cshperspect.a001537) [DOI] [PMC free article] [PubMed] [Google Scholar]
- 51.Casson SA, Hetherington AM. 2010. Environmental regulation of stomatal development. Curr. Opin. Plant Biol. 13, 90–95 10.1016/j.pbi.2009.08.005 (doi:10.1016/j.pbi.2009.08.005) [DOI] [PubMed] [Google Scholar]
- 52.Kim TH, Böhmer M, Hu H, Nishimura N, Schroeder JI. 2010. Guard cell signal transduction network: advances in understanding abscisic acid, CO2, and Ca2+ signaling. Annu. Rev. Plant Biol. 61, 561–591 10.1146/annurev-arplant-042809-112226 (doi:10.1146/annurev-arplant-042809-112226) [DOI] [PMC free article] [PubMed] [Google Scholar]


