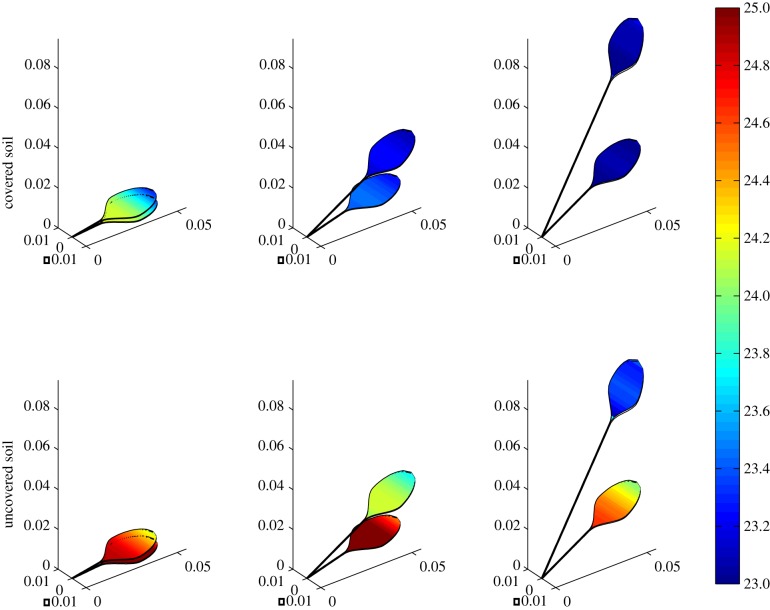
Figure 10.
Two leaves, covered versus uncovered soil: temperature (°C) heat maps imposed on leaf geometry, showing temperature distribution through leaves and petioles in three two-leaf plants. In the top row, there is no water vapour flux normal to the plane y = 0, as in the covered-soil experiments in Crawford et al. [2], whereas the bottom row simulates an uncovered soil. Axis scales are in metres.

