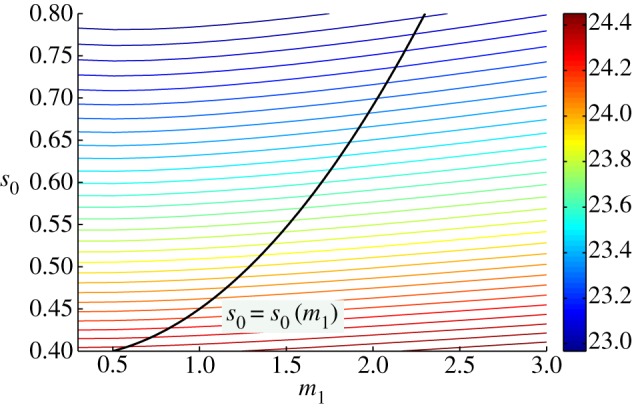
Figure 14.

One leaf, varying petiole inlet saturation: temperature T1 at steady state in response to varying water supply at petiole vertex/inlet. With fixed s0, increasing m1 gives increased T1. However, increasing m1 (and also s0) along the curve in black gives reduced T1.
