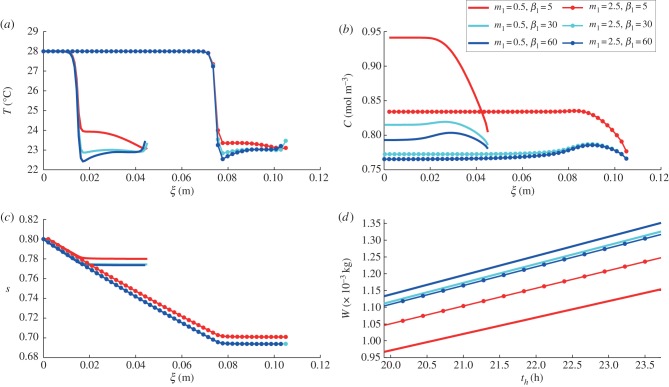
Figure 5.
Single leaf, varying architecture: (a) temperature T, (b) water vapour concentration C and (c) liquid saturation s profiles (as functions of leaf/petiole axial coordinate ξ) at steady state for a single leaf after introduction to 28°C environment, (d) with total water loss W time courses. Elongation and elevation are controlled by varying m1 and β1. Leaf length = 0.03 m, so for m1 = 0.5, the leaf–petiole junction is at ξ = 0.15, whereas for m1 = 2.5, the leaf–petiole junction is at ξ = 0.75.

