
Figure 1.
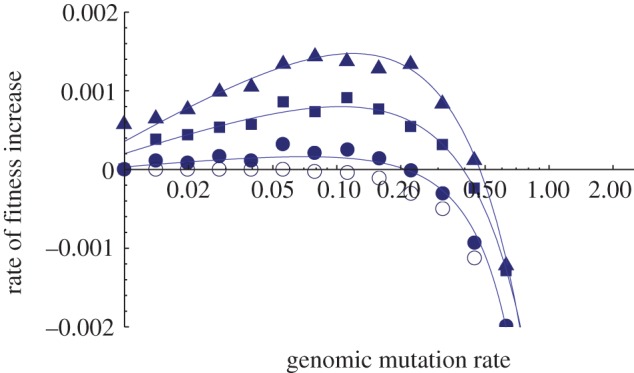
Time-averaged fitness gradients from simulations of adapting populations as a function of genomic mutation rate. Simulations are fully stochastic and individual-based; populations are asexual. (See the electronic supplementary material for details.) Each point represents the average of eight independent simulation runs. The fraction of mutations that are deleterious is constant at 0.1, and the effects of all mutations are drawn at random from an exponential distribution with mean 0.03. At high enough mutation rates, the rate of fitness increase becomes negative (indicating persistent fitness decline), from which inference of eventual extinction seems reasonable. Filled circles plot simulation results in which population size is 10 000 and the fraction of mutations that are beneficial is 10−5; filled squares plot simulation results in which population size is 50 000 and the fraction of mutations that are beneficial is 10−5; filled triangles plot simulation results in which population size is 10 000 and the fraction of mutations that are beneficial is 10−4; open circles plot simulation results in which population size is 10 000 and the fraction of mutations that are beneficial is zero (classical Muller's ratchet). (Online version in colour.)