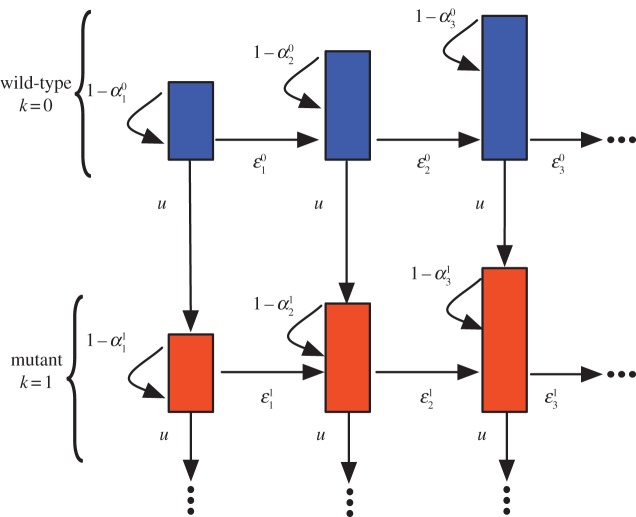
Figure 1.
Schematic of the compartment structure of multiple mutations and the corresponding transition rates. The top compartments contain cells carrying no mutation. The bottom compartments contain cells carrying one mutation. Compartments to the right represent more specialized cell stages and arrows represent transition probabilities, where ɛ denotes the differentiation probability, u denotes the mutation rate of cells and  . Initially, no mutated cells are present in the hierarchy. We then determine, how many cells are acquired from the founder compartment (top left) and investigate how many cells with k mutations are on average expected at any stage of the hierarchy. (Online version in colour.)

