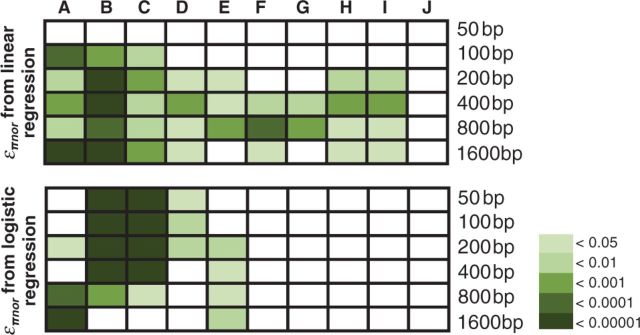
Fig. 3.

Statistical significance for comparisons of επnor of fixations associated with different biological categories. Upper and lower graphs are for comparisons using επnor from linear regression and logistic regression, respectively. All P values were calculated using Mann–Whitney U test unless otherwise specified. Increased statistical significance is represented with darker color. Comparisons shown are (A) nonsynonymous substitutions (lower επnor) versus synonymous substitutions, (B) nonsynonymous substitutions of single-substitution genes (lower επnor) versus synonymous substitutions of single-substitution genes, (C) nonsynonymous substitutions of single-substitution genes (lower επnor) versus nonsynonymous substitutions of other genes, (D) synonymous substitutions of single-substitution gene versus synonymous substitutions of other genes (lower επnor), (E) nonsynonymous substitutions that changed amino acid chemical properties in different ways (Kruskal–Wallis test), (F) nonsynonymous substitutions that did not change amino acid charges versus nonsynonymous substitutions that changed amino acid charges (lower επnor), (G) nonsynonymous substitutions that increased amino acid acidity versus nonsynonymous substitutions that increased amino acid basicity (lower επnor), (H) nonsynonymous substitutions that reinforced the chemical property changes of the nearest amino acid substitutions on the same linage (both on D. melanogaster) versus those compensated for these changes (lower επnor), (I) nonsynonymous substitutions that reinforced the polarities changes of the nearest amino acid substitutions on the same linage (both on D. melanogaster) versus those compensated for these changes (lower επnor), and (J) nonsynonymous substitutions that reinforced the charge changes of the nearest amino acid substitutions on the same linage (both on D. melanogaster) versus those compensated for these changes.
