


Figure 2.
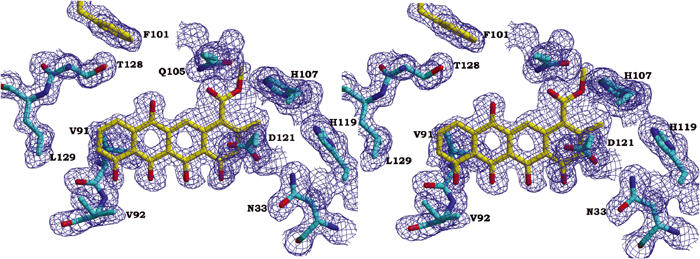
Part of a composite omit 2Fo–Fc electron density map at 1.35 Å resolution, contoured at 1.0σ. The area displayed shows the bound ligand and the surrounding amino-acid residues.
Official websites use .gov
A
.gov website belongs to an official
government organization in the United States.
Secure .gov websites use HTTPS
A lock (
) or https:// means you've safely
connected to the .gov website. Share sensitive
information only on official, secure websites.
Part of a composite omit 2Fo–Fc electron density map at 1.35 Å resolution, contoured at 1.0σ. The area displayed shows the bound ligand and the surrounding amino-acid residues.