
Figure 7.
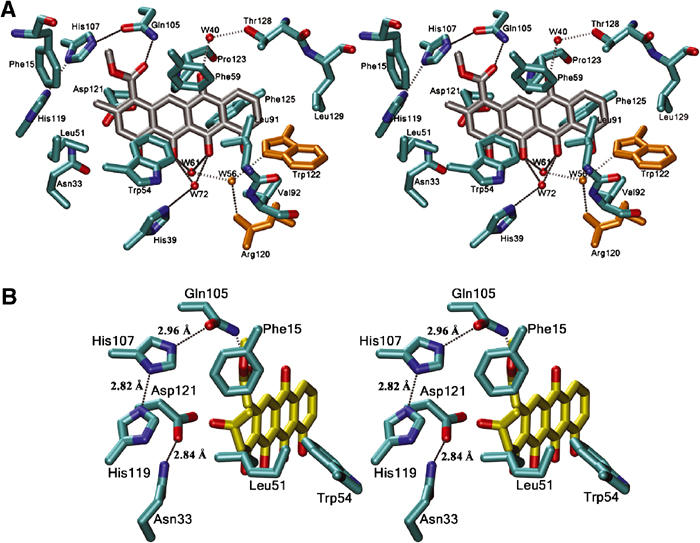
(A) Stereoview of the substrate/product binding site in SnoaL. The interactions of the bound aglycone with the surrounding protein side chains and water molecules are shown (cutoff distances: 3.2 Å for hydrogen bonds, 3.8 Å for van der Waals interactions). Residues shown in yellow are from the second subunit. (B) Modelled Michaelis complex of SnoaL with the substrate NAME. Only interactions with putative catalytic groups are shown.