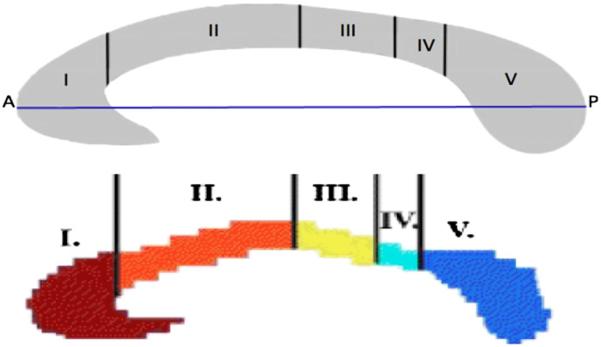
Fig. 3.

Original and adjusted Hofer–Frahm scheme. Top: illustration of Hofer–Frahm scheme subdivision proportions with A–P line in blue. Bottom: adjusted MATLAB division of proposed Hofer–Frahm scheme. Region I: prefrontal; region II: premotor and supplementary motor; region III: motor; region IV: sensory; region V: parietal, temporal, and occipital. A, anterior; P, posterior (Hofer and Frahm, 2006). (For interpretation of the references to color in this figure legend, the reader is referred to the web version of this article.)
