
Figure 5.
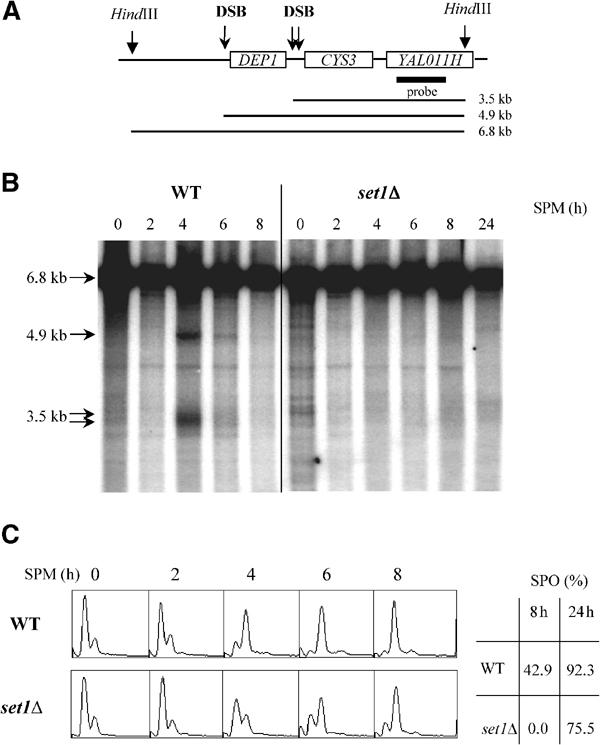
Reduced amounts of meiotic DSBs in set1Δ (SK1 background). (A) Map of the DEP1-CYS3 locus. The positions of the HindIII restriction sites and the sizes of the DNA fragments generated by the meiotic DSBs are indicated. The thick line represents the position of the DNA probe used for hybridization analysis. (B) Southern analysis of meiotic DSB kinetics. Genomic DNA from cells taken from sporulation medium (SPM) at the indicated times (hours) was extracted, digested with HindIII, and probed with a sequence specific to YAL011H. Arrows show the unbroken HindIII fragment and those corresponding to meiotic DSBs. (C) Left: FACS analysis were carried out to follow meiotic DNA replication in the same experiment as in (B) at the indicated times after shift in sporulation medium. Right: sporulation rates were determined after 8 and 24 h.