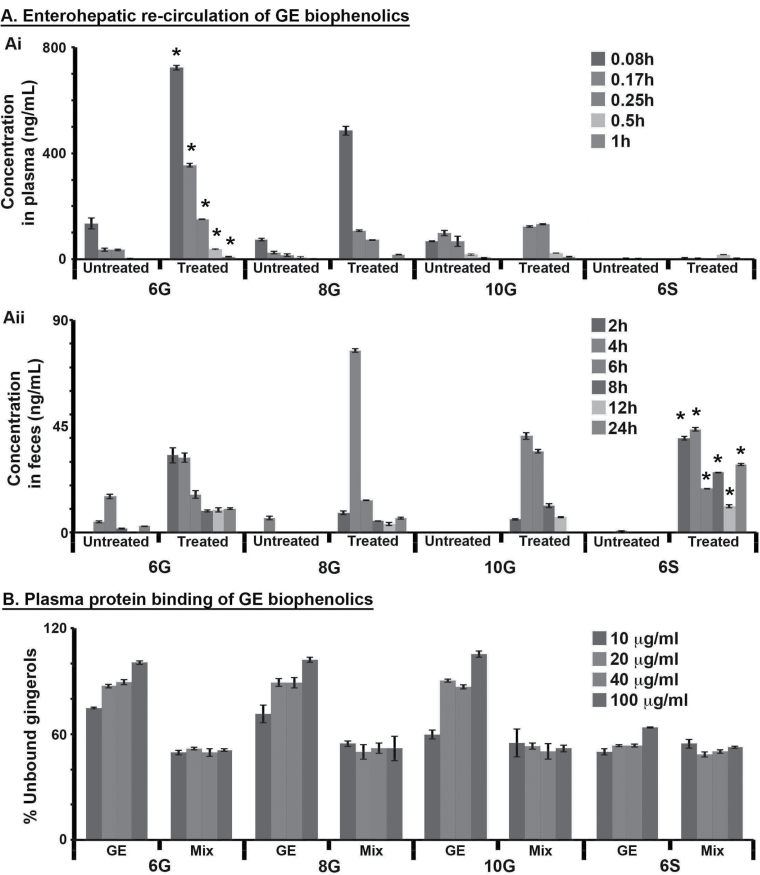
Fig. 4.
β-Glucuronidase activity assay in plasma and feces obtained from mice IV injected with individual active ginger constituents. (Ai) Comparison of plasma concentration-time profile of 6G, 8G, 6S and 10G in untreated and β-glucuronidase-treated plasma samples following IV dose administration of individual ginger phytochemicals. The values of 6G, 8G, 10G and 6S in the enzyme-treated plasma samples were compared with the untreated samples using independent sample t-test. There was no significant difference in values of 8G, 10G and 6S (P > 0.005) but were different for 6G (*P < 0.005). (Aii) Comparison of concentration-time profiles of 6G, 8G, 6S and 10G in untreated and β-glucuronidase-treated feces samples following IV dose administration. The values of 6G, 8G, 10G and 6S in treated feces samples were compared with untreated samples using independent sample t-test. There was no significant difference in values of 6G, 8G and 10G (P > 0.005) but were different for 6S (*P < 0.001). (B) Plasma protein binding of gingerols in GE versus Mix. Percentage of unbound gingerols in GE is more than in Mix when compared at different concentrations. Error bars refer to ±SD.

