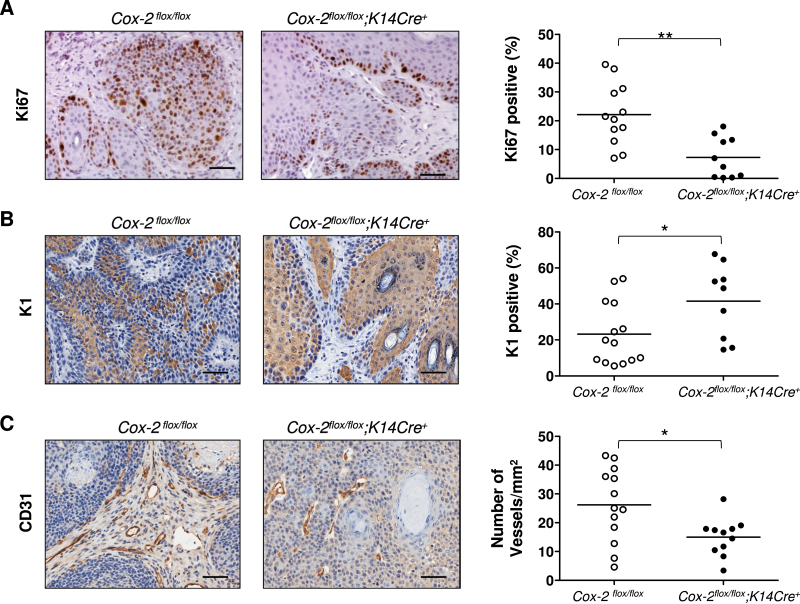
Fig. 6.
Tumor cell proliferation, tumor cell differentiation and tumor vascularization of UVB-induced tumors from mice with an epithelial cell-specific Cox-2 gene deletion. (A) Ki67 protein expression in tumors of SKH-1 Cox-2 flox/flox ;K14Cre + mice and their littermate Cox-2 flox/flox mice. The panels on the left show IHC results. The graph on the right shows quantification of the percentage of Ki67-positive epithelial cells. (B) K1 protein expression in tumors of SKH-1 Cox-2 flox/flox ; K14Cre + mice and their littermate Cox-2 flox/flox mice. The panels on the left show IHC results. The graph on the right shows quantification of the percentage of K1-positive epithelial cells. (C) Vascularization of tumors from SKH-1 Cox-2 flox/flox ;K14Cre + mice and their littermate Cox-2 flox/flox mice. The panels on the left show IHC results for the CD31 endothelial antigen, outlining vessels. The graph on the right shows quantification of the number of vessels per square millimeter of tumor. For all cases, each symbol represents the measurement from a single tumor. *P < 0.05. **P < 0.01. Scale bar: 50 µm.

