Fig. 5.
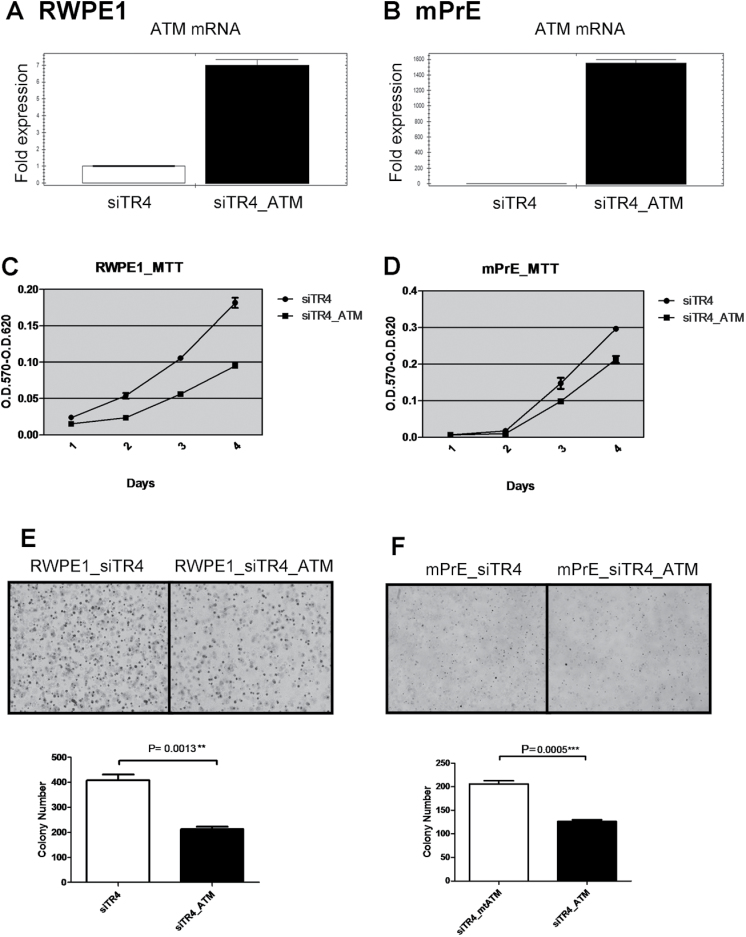
ATM interrupts loss of TR4-induced prostate tumorigenesis.
(A and B) Quantitative PCR shows ATM mRNA overexpression in both RWPE1_siTR4 and mPrE_siTR4 cell lines. RWPE1siTR4_ATM and mPrEsiTR4_ATM represent ATM overexpression in these two cell lines. (C–F) Stably overexpressing functional ATM partially interrupted TR4 siRNA-induced cell growth (C and D) and colony formation (E and F, upper panels) after carcinogen MNU treatment in both RWPE1 and mPrE cell lines. Quantitations are shown in the lower panels of E and F and the P values were calculated by Student’s t-test.

