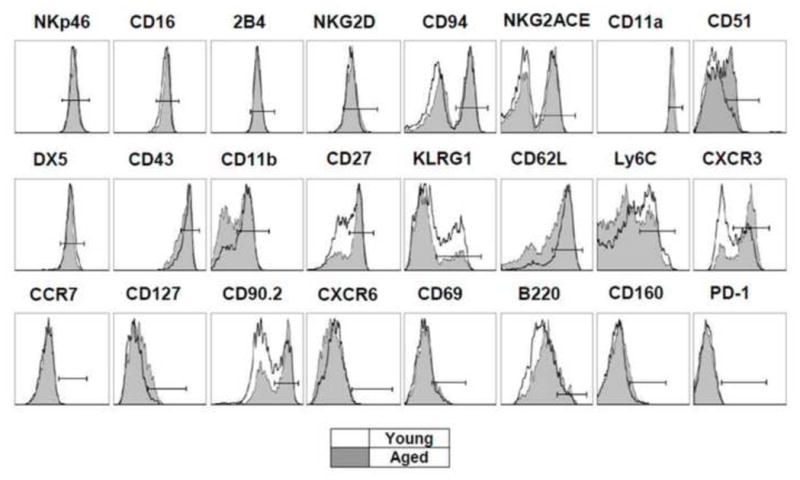
Figure 1. Phenotypic characterization of NK cells from spleens of young and aged mice.

Histograms are representative of the average values for each group, n = 5–15, depending on the marker, but n is equal in young and aged NK cells for each marker. Empty histograms represent NK cells from young mice, while shaded histograms are NK cells from aged mice.
