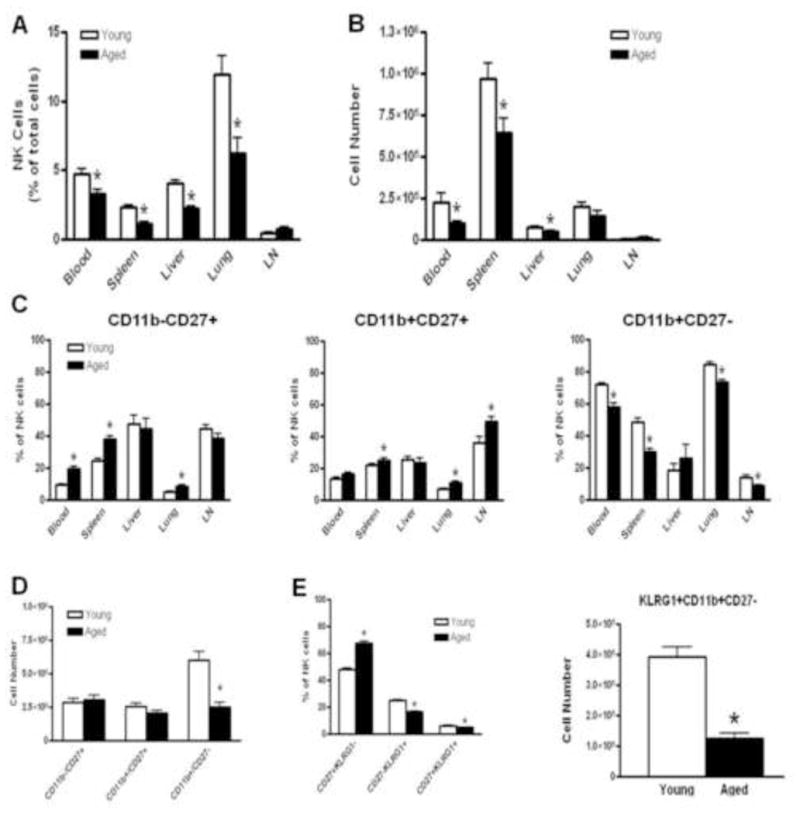
Figure 2. NK cell distribution in various peripheral tissues of young and aged mice.

NK cells gated as NK1.1+, NKp46+, CD3ε−, CD19− cells. (A) NK cells as percentage of lymphocytes gated based on their FSC/SSC profile. (B) Numbers of NK cells in spleen (n=15), lungs (n=15), blood (NK cells/PBMCs per mL of blood) (n=15), liver (n=5) and lymph nodes (n= 5). (C) NK cell subsets based on CD11b/CD27 markers as a percentage of lymphocytes. (D) Numbers of CD11b/CD27 NK cell subsets in spleen. (E) NK cell subsets based on KLRG1/CD27 markers as percentage of lymphocytes. Asterisks (*) indicate statistically significant difference between young and aged groups, t-test, p < 0.05.
