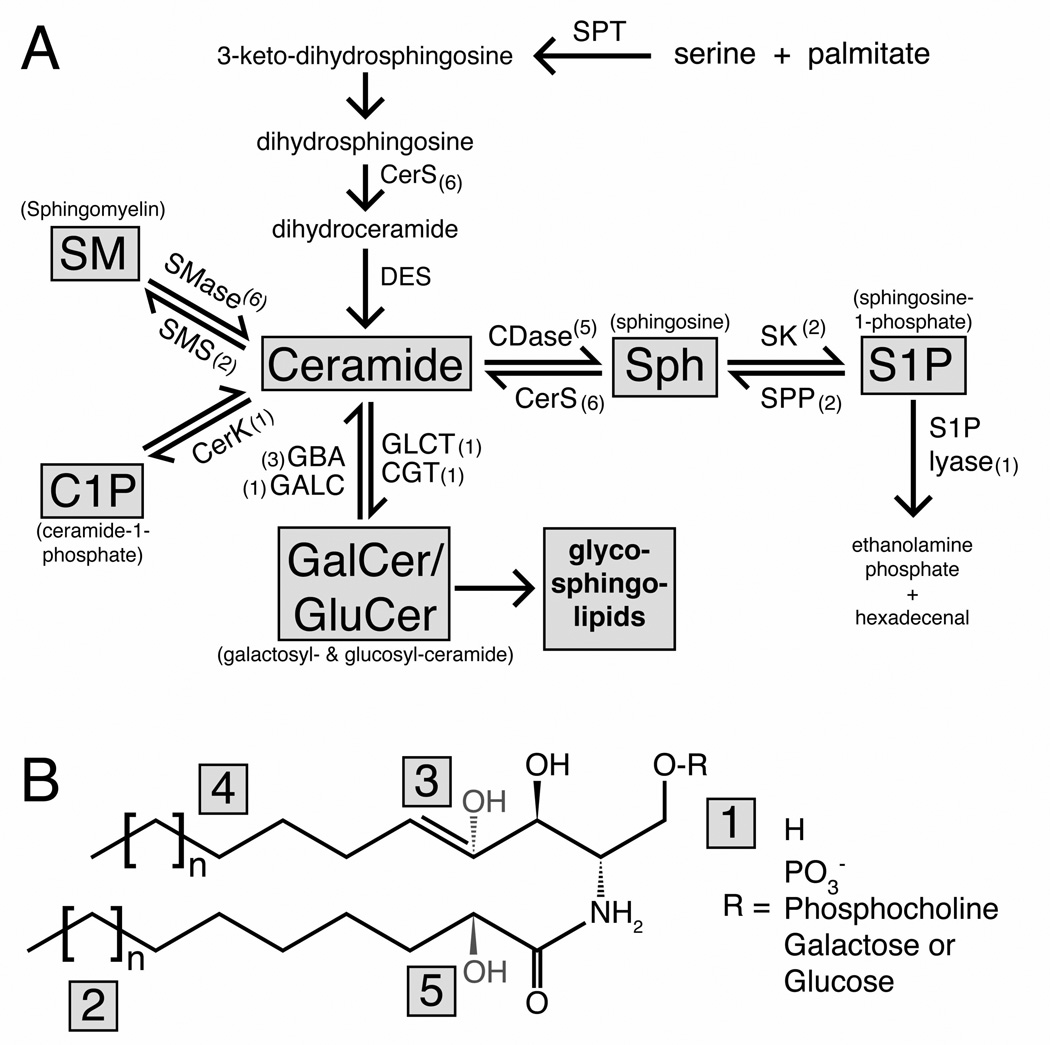
Figure 1. Sphingolipid metabolism and chemical structure.
(A) Diagram of sphingolipid metabolism showing the major lipid species in grey boxes and sphingolipid metabolizing enzymes. The number of mammalian genes that catalyze each conversion are denoted by brackets. (B) Generic structure for sphingolipid molecules with modification points. The presence or absence of the acyl chain (lower chain) distinguishes ceramide (shown) from sphingosine. Variation in the headgroup (1), attached to the terminal 1-oxygen, distinguishes each family of sphingolipids. The length of the sphingoid backbone (4) or acyl-chain (2) generates subspecies within each family. Further modification at the 4,5 position on the sphingoid backbone (3) can occur with different saturation levels (e.g. dihydroCer vs. Cer) and hydroxylation. In addition, the acyl chain can be hydroxylated at the 2-position (5). Abbreviations: SPT = serine phosphoryltransferase, CerS = (dihydro)ceramide synthase, DES = dihydroceramide desaturase, SMase = sphingomyelinase, SMS = sphingomyelin synthase, CerK = ceramide kinase, GBA = glucosylceramidase, GALC = galactosylceramidase, GCLT = ceramide glucosyltransferase, CGT = ceramide galactosyltransferase, CDase = ceramidase, SK= sphingosine kinase, SPP = S1P-phosphatase.

