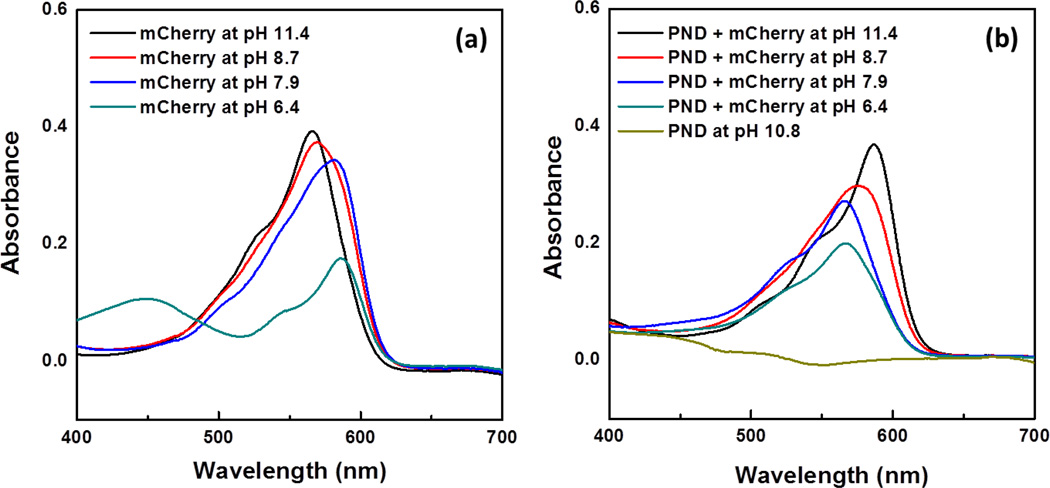
Figure 3.
Solution-state UV-Vis spectra of (a) mCherry (12 nmol/ml) and (b) mCherry (12 nmol/ml) and PND (170 nmol/ml) mixtures with changing pH. The primary absorbance peak of mCherry blue shifts as pH increases, but in the presence of PND, the primary absorbance peak red shifts with increasing pH, owing to electrostatic interactions between the protein and the PDMAEA block. mCherry concentration is equal in all samples.

