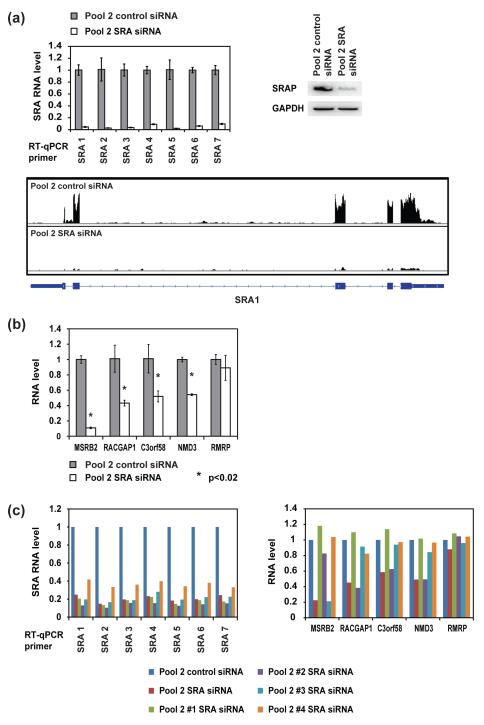
Figure 7. RT-qPCR examination of the top candidates for SRA/SRAP-regulated genes identified with RNA-seq.
(a) Verification of SRA knockdown in the RNA-seq samples. MCF-7 cells were transfected with 25 nM corresponding siRNA pool. Cells were harvested 32 hours after transfection. Top left: SRA RNA level, measured by RT-qPCR (error bars represent SD, n = 3, with GAPDH mRNA as internal control). Top right: SRAP protein level, measured by western blot (antibody: Abcam ab72407, with GAPDH protein as internal control). Bottom: RNA-seq data at the locus of SRA also confirm the knockdown. (b) RT-qPCR verification of the expression level differences of the candidate genes at 32 hours after transfection with 25 nM corresponding siRNA pool, with GAPDH mRNA as internal control (error bars represent SD, n = 3). (c) The expression level changes of the candidate genes are not consistent when SRA is knocked down with individual siRNAs in pool 2. MCF-7 cells were transfected with 25 nM of the indicated siRNA. 32 hours after transfection, RNA levels of SRA and the candidate genes were examined with RT-qPCR, with GAPDH mRNA as internal control (n = 1).

