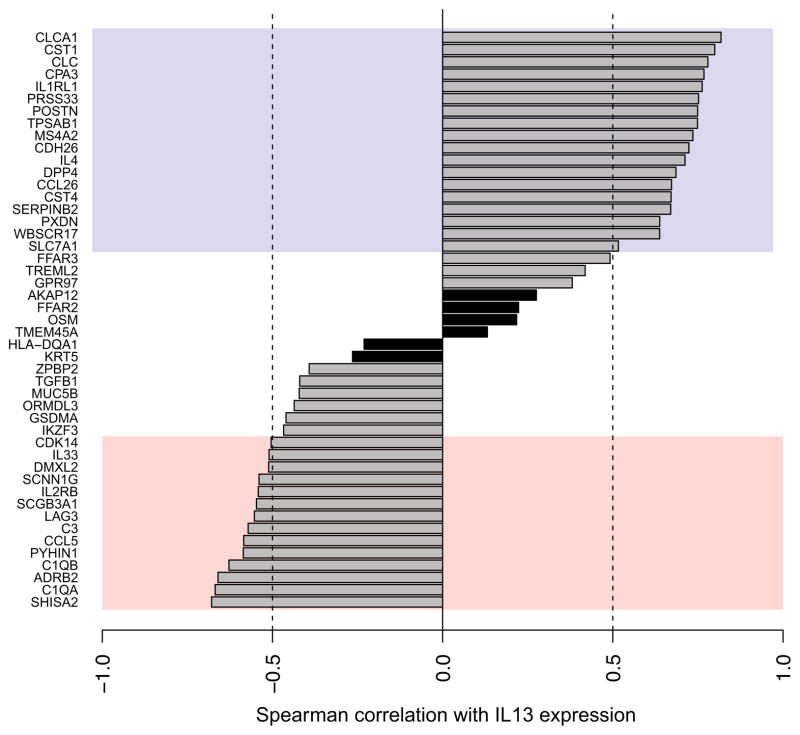
Figure 4. Correlation between Ampliseq nasal gene expression of IL13 and the other 47 genes differentially expressed in asthma.
Genes are ranked from top to bottom by decreasing Spearman correlation coefficient (ρ). Purple and pink regions correspond to levels of high positive (ρ > 0.5) and negative (ρ < −0.5) correlation, respectively. Significant IL13 correlations=clear bars, Non-significant IL13 correlations=black bars.

