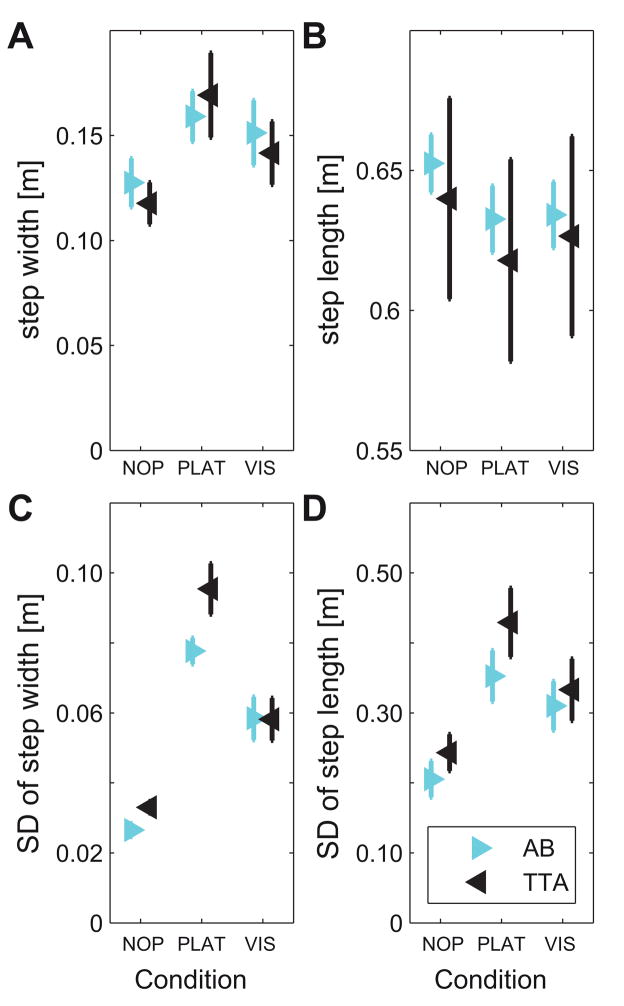
Figure 2. Stepping Parameters (Step Length and Width) and Stepping Variability.
A: Mean step width, B: Mean step length, C: Step width variability, and D: Step length variability. Each graph shows data separately for all healthy controls (AB) and all amputees (TTA) for all three walking conditions. Error bars indicate the appropriate between-subject ± standard error.

