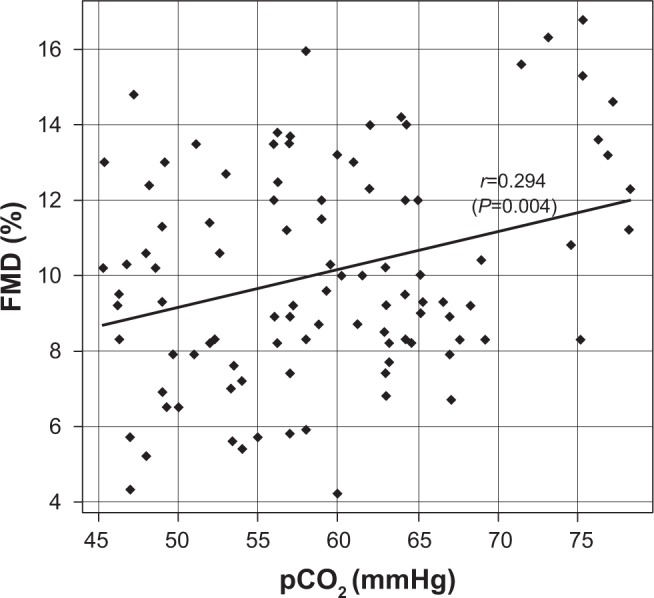
Figure 2.

Scatter plot for FMD against pCO2 values (both measured at phase 1) and Pearson’s correlation coefficient (r).
Abbreviation: FMD, flow-mediated dilation.

Scatter plot for FMD against pCO2 values (both measured at phase 1) and Pearson’s correlation coefficient (r).
Abbreviation: FMD, flow-mediated dilation.