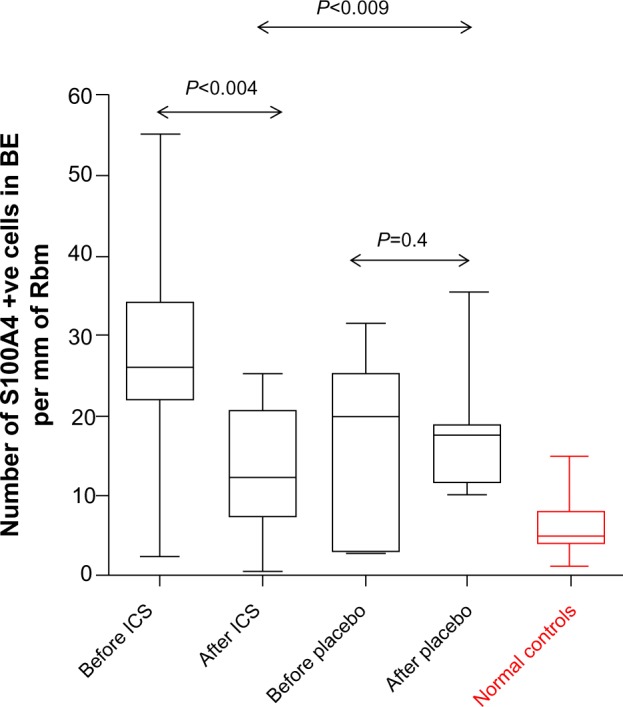
Figure 5.

S100A4 in basal epithelium.
Notes: Number of S100A4 positive cells in the BE before and after ICS versus before and after placebo, with normal control data for comparison. Changes over time with ICS were also statistically significant compared to those on placebo (P<0.009). After treatment, the active group was statistically significantly different to normal controls (P<0.02). Data are represented as medians and ranges.
Abbreviations: BE, basal epithelium; ICS, inhaled corticosteroids; Rbm, reticular basement membrane.
