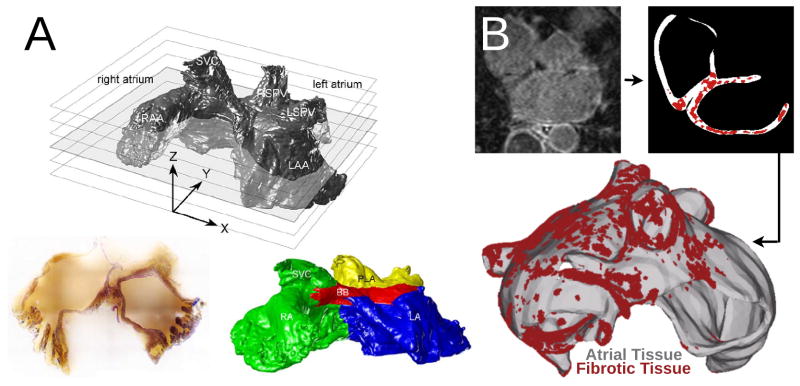
Figure 2.
Geometrical models of the atria. A: Volume image of the sheep atria acquired by serial surface imaging (resolution 50 microns), with a representative slice. Subdivision of atria into different regions as represented by the different colors: RA—green, LA—blue, Bachman’s bundle (BB)—red, posterior left atrium (PLA)—yellow. Images reproduced with permission from50,51. B: A model of the fibrotic human atria generated from a patient LGE-MRI scan (top left) following segmentation (top right) into normal and fibrotic tissue (fibrotic lesions in red). With permission from62.

