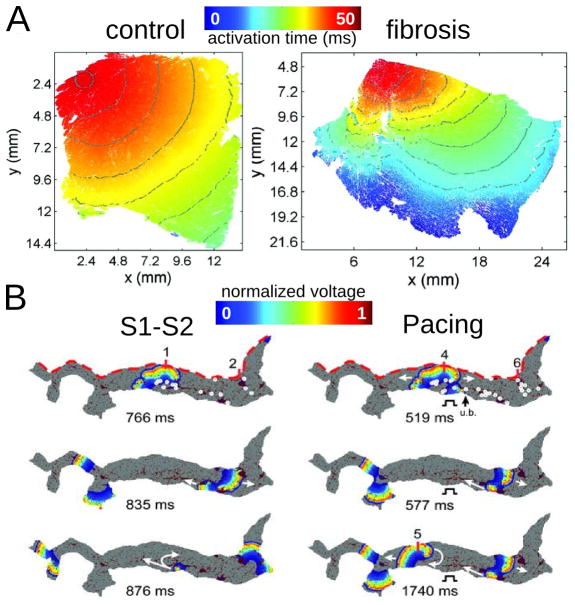
Figure 6.
Modeling fibrosis as regions of collagen presence. Collagen is represented as an insulator. A: Simulations of propagation in 2D tissue sections (control, left, and fibrosis, right). With permission from115. B: Simulations in LA transmural slices for HF conditions. Snapshots at several timeframes for cross-field stimulation (left) and pacing at a frequency of 6Hz (right). Colors indicate transmembrane voltage from low (blue) to high (red). The site of unidirectional block(ub.) is indicated by a black arrow. White circles on the upper voltage maps indicate sites of wavebreak. With permission from122.

