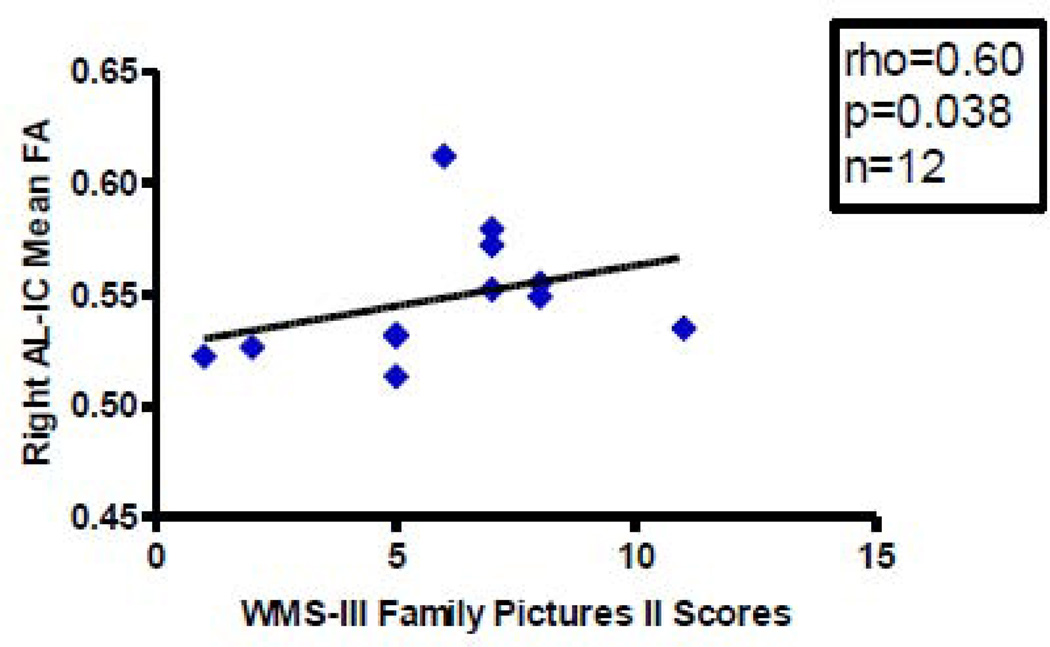
Figure 4.
Scatterplot between WMS-III Family Pictures II Scale Scores and Right AL-IC FA in Schizophrenia. Although we used Spearman’s rho for testing statistical significance because of our small N, we have plotted a least squares line for the convenience of the reader. Although we used Spearman ρ for testing statistical significance because of our small sample size, we have plotted a least squares line for the convenience of the reader.

