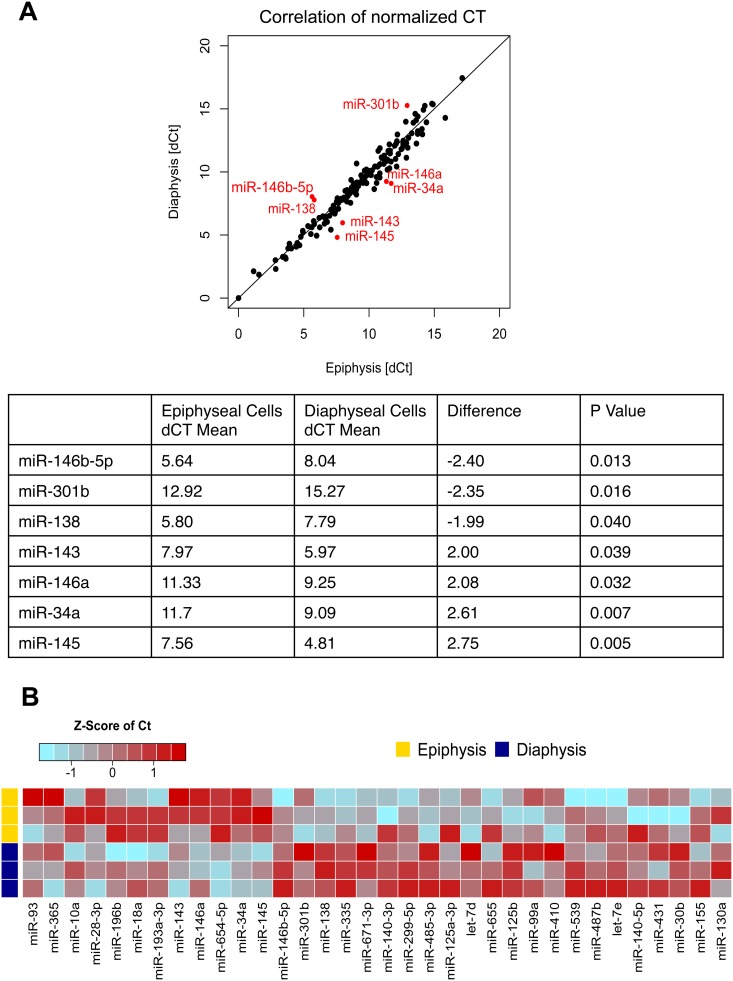
Figure 4. MicroRNA expression profile of epiphyseal and diaphyseal cells.
CT values of each miR was normalized to MammU6 (dCT) and plotted as an XY scattered chart displaying the correlation of miR expression by epiphyseal and diaphyseal cells. An unpaired t-test revealed 7 miRs with significant differences in expression: miR-146a-5p, miR-301b and miR-138 displayed higher expression in epiphyseal cells while miR-143, miR-146a, miR-34a and miR-145 displayed higher expression levels in diaphyseal cells (A). A heat map of normalized CT values was generated to show the difference in miR expression between epiphyseal and diaphyseal cell populations (B). The Heat map represents z-transformed expression, blue represents higher level of expression and red represents lower level of expression.

