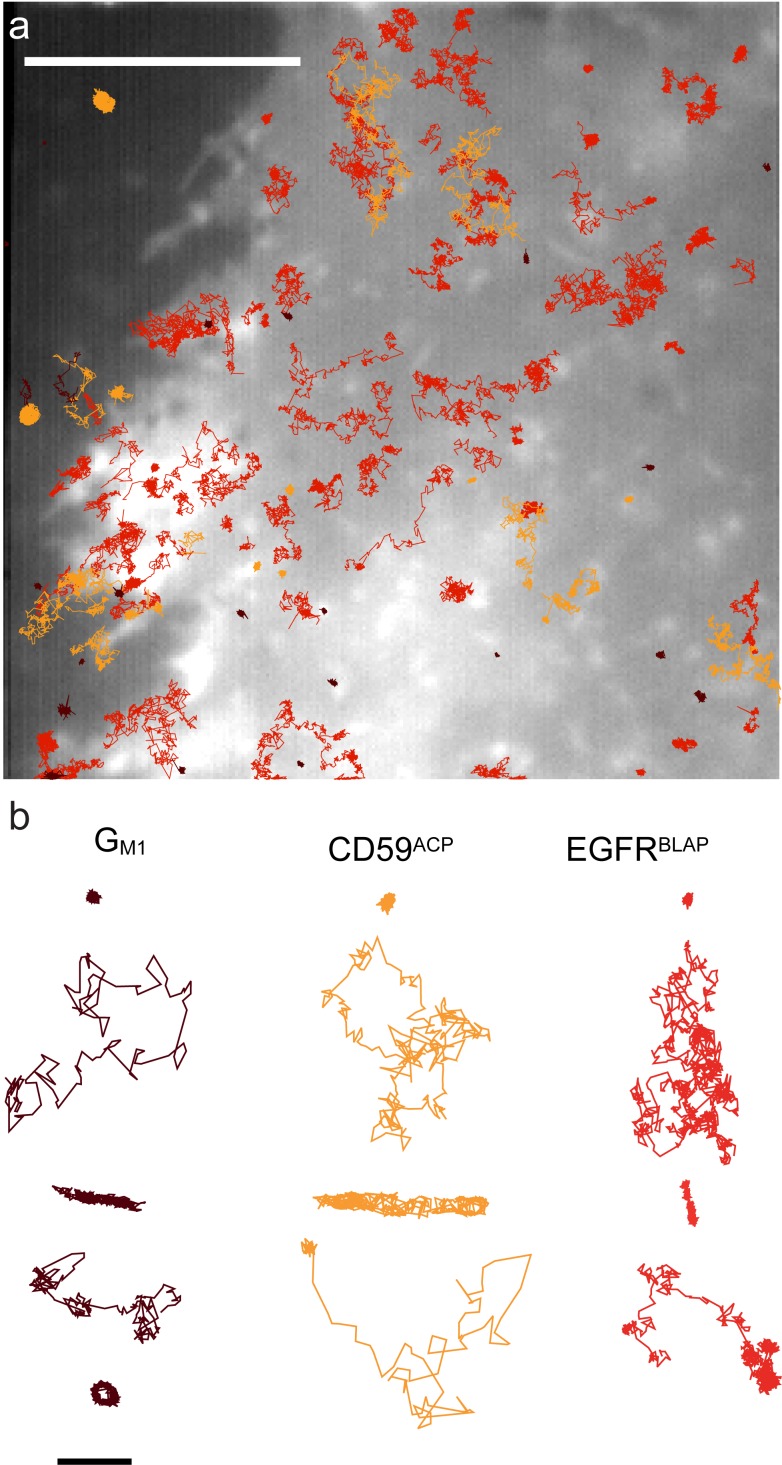
Figure 2. SPT trajectory examples.
(a) Overlay of summed intensity image of K-Ras2-YFP and the calculated QD trajectories longer than 50 displacements. Dark red is GM1, red CD59ACP, and orange EGFRBLAP. Scale bar is 10 µm. (b) Examples of single trajectories for the three different molecular species. There are in all cases numerous examples of confined, free Brownian, and directed motion as well as various combinations thereof. Scale bar is 1 µm.

