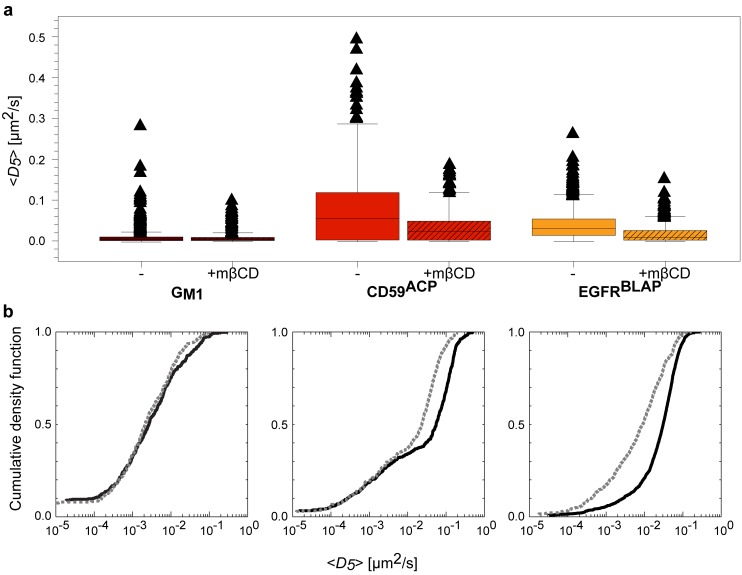
Figure 3. Single molecule diffusion of GM1, CD59ACP, and EGFRBLAP.
(a) Box-and-whisker plots of the single molecule diffusion coefficients D 5 for the three molecular species; GM1 (dark red), CD59ACP (red), and EGFRBLAP (orange), in non-treated (full color) and cholesterol depleted (hatched color) cells, respectively. (b) Cumulative density functions of the D5 for untreated (black) and cholesterol depleted (grey dashed) cells. A statistical significant difference between the populations of D 5 (K-S test) after cholesterol treatment was observed for CD59ACP and EGFRBLAP. Statistical significant differences were also observed between the different molecular species both in non-treated and cholesterol depleted cells.

