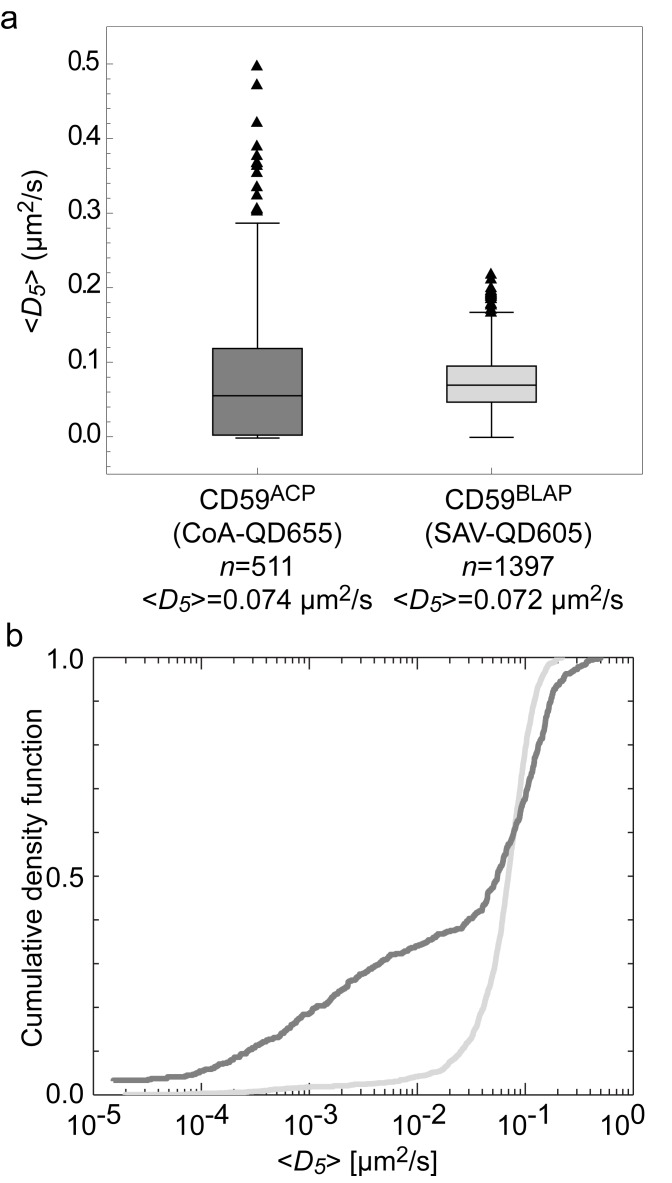
Figure 6. Comparison of SAV-QD605 and CoA-QD655 conjugates.
(a) Box-and-whiskers plot of the diffusion coefficients for CD59ACP and CD59BLAP targeted with CoA-QD655 (dark gray) and SAV-QD605 (light gray). The mean diffusion coefficients of the two populations are numerically very close. (b) Cumulative density function plot of the diffusion coefficients of CD59ACP and CD59BLAPshowing that the distributions are non-identical.

