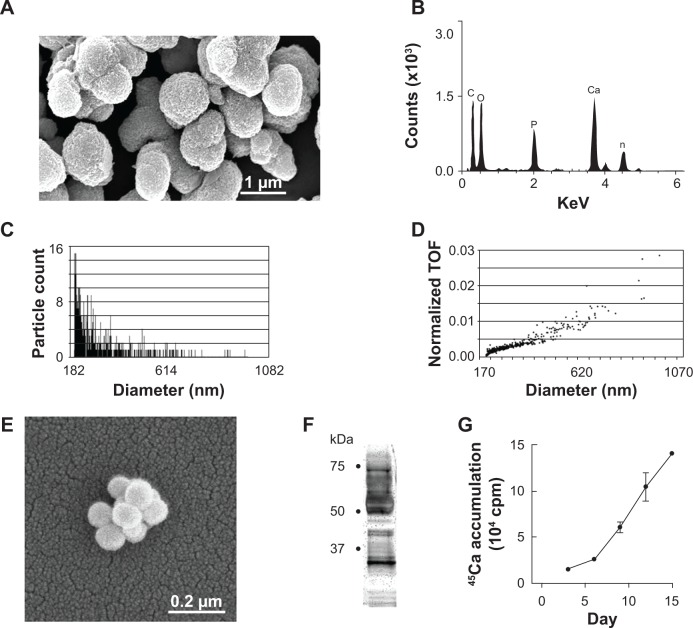
Figure 1.
Characterization of CNPs.
Notes: Scanning electron microscopy of particles (A). EDX analysis identified Ca and P (B). The size of CNPs ranged from 20 nm to about 1 μm; most CNPs averaged 210 nm (C). The largest proportion of particles relative to the total population was near the 220 nm size-range (TOF) (D). CNP demineralization revealed smaller structures (E), shown by SDS-PAGE/silver staining to be comprised of numerous proteins (F). Incorporation of 45Ca into CNPs under culture conditions in the absence of cells was nearly linear (mean ± SEM, n=6–8) (G).
Abbreviations: 45Ca, radiolabeled calcium; CNPs, calcifying nanoparticles; EDX, energy-dispersive elemental analysis; P, phosphate; TOF, time of flight; (SDS-PAGE), sodium dodecyl sulfate polyacrylamide gel electrophoresis.

