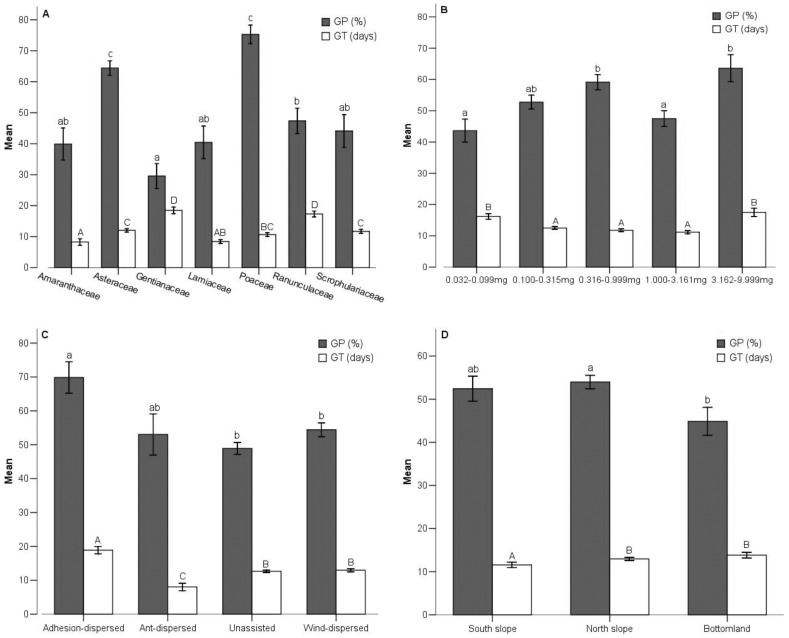
Figure 2. Germination percentage (GP) and mean germination time (GT) in different taxonomic groups.
(A) GP and GT of seeds from seven families; (B) GP and GT of seeds from five seed size groups; (C) GP and GT of seeds from four dispersal mode groups; (D) GP and GT of seeds from three habitats. Bars (mean±SE) that do not share a letter represent significantly different values at P<0.05 level (Turkey multiple comparison test). Different lowercase letters and capital letters indicate significant difference of GP and GT, respectively.

