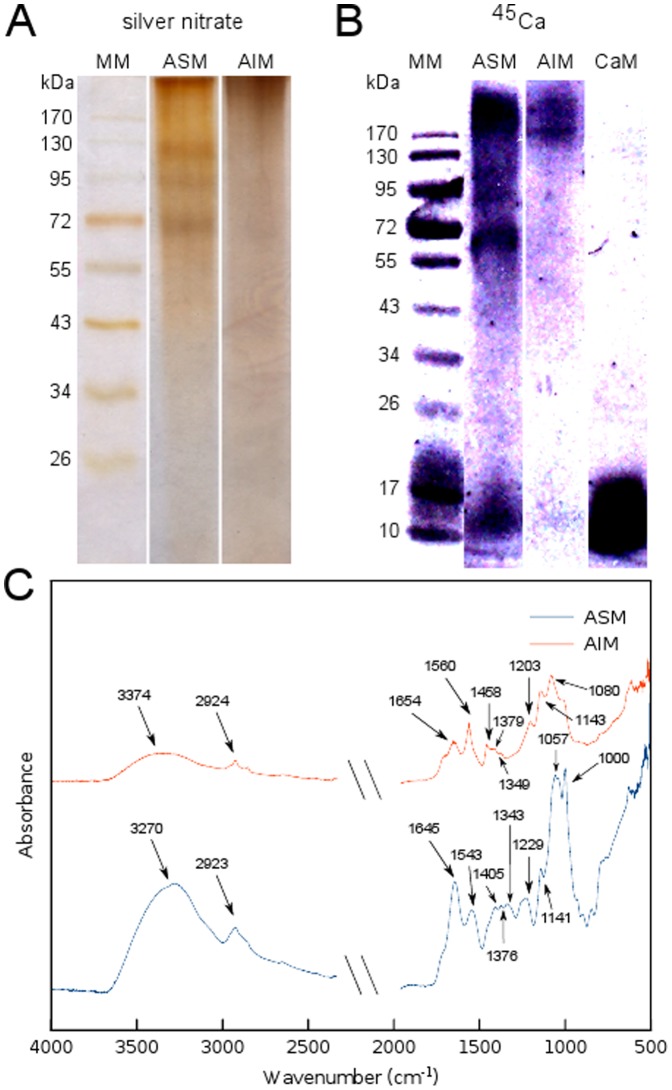
Figure 2. Molecular composition of the skeletal organic matrix from A. millepora.
(A) Analysis of electrophoresis on gel after AgNO3 staining.(B) PVDF membrane revealed by autoradiography with 45Ca, calmodulin (CaM)was used as positive control. (C) Infrared absorption spectra of ASM and AIM fractions with assignment of the main peaks. MM – Molecular marker, ASM – Acid soluble matrix, AIM – Acid insoluble matrix.

