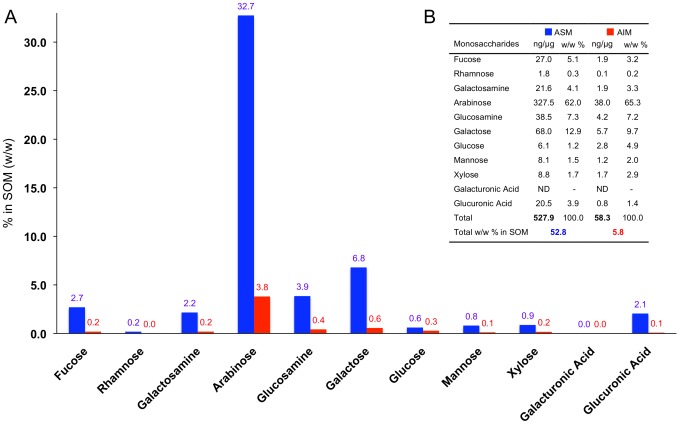
Figure 3. Quantification of neutral, aminated and acidic monosaccharides in the ASM (blue) and in the AIM (red) of A. millepora.
Samples were hydrolyzed with 2°C (4 h). (A) Total Wt. % in the skeletal organic matrix (SOM, either ASM or AIM) are indicated in the graph (bars). (B) Concentrations (ng/µg) and relative molar percentages are shown in the table for both matrices.

