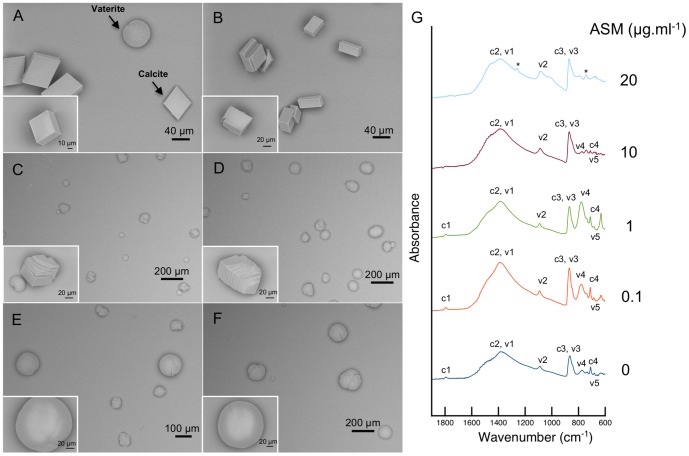
Figure 4. SEM images of CaCO3 crystals grown in vitro with the addition of different concentrations of ASM: (A) 0 µg.ml−1, (B) 0.1 µg.ml−1, (C) 1 µg.ml−1, (E) 5 µg.ml−1, (E) 10 µg.ml−1 and (F) 20 µg.ml−1.
(G) Corresponding FTIR(ATR) absorbance spectra on the whole precipitated for the following ASM concentrations: 0, 0.1, 1, 10 and 20 µg.ml−1.

