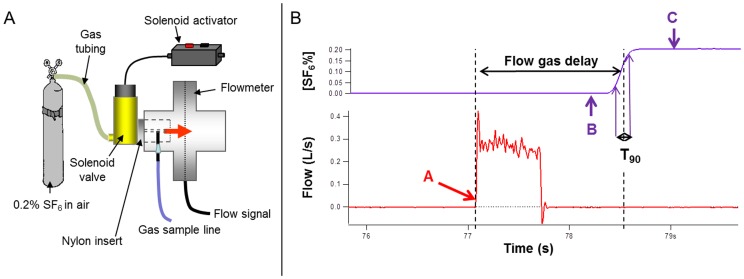
Figure 1. Measurement of flow gas delay (FGD) and response time.
1A: An instantaneous flow signal and square wave of SF6 was generated using an electronic solenoid-activated valve to direct a stream of 0.2% SF6 past the gas sample needle and onto the flowmeter mesh. 1B: Flow signal (red) showing a sudden rise when the solenoid is activated. Point A is the zero point for start of FGD measurement. SF6 signal is shown in purple with zero point (B) and SF6 plateau (C) identified. The software then identifies the 50% rise point, as the end of FGD, and the 10–90% rise time (T90).

