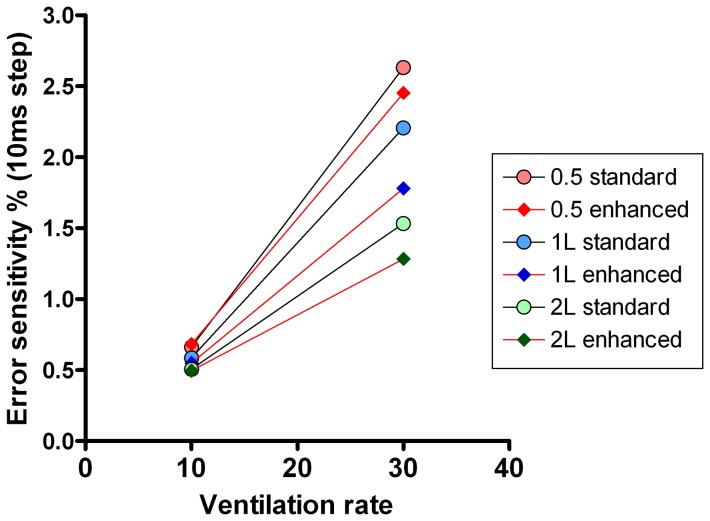
Figure 8. Error sensitivity of lung volume calculation.
Error sensitivity of the two different Innocor systems (speeded with T90 = 88 ms, and slow with T90 = 154 ms) at two different lung model ventilation rates. Performances of the speeded system are joined by red lines, those of the slow system by black lines. Error sensitivity was defined as the % error in FRC that would be caused by a 10 ms (single sample step) mis-alignment in flow gas delay.

