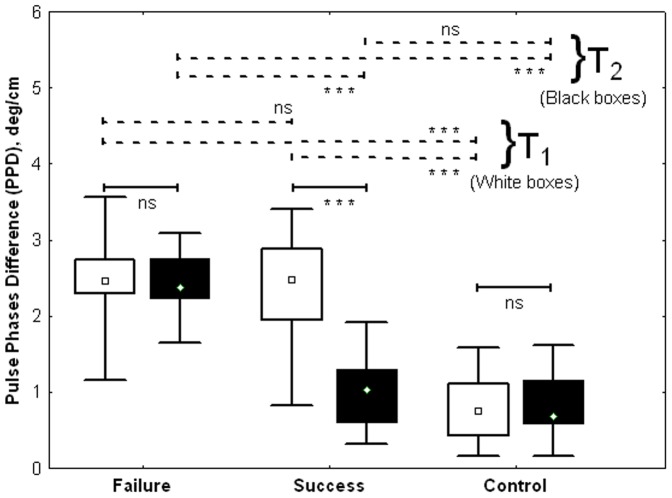
Figure 7. PPD during the study in function of classification in Failure, Success and Control groups (Median; Box: 25th -75th percentile; Whisker: Minimum-Maximum).
The values of PPD (deg/cm) at the beginning of the study at T1 are represented with white boxes and at the end of the study (T2), with black boxes (***: p<0.001; ns: non significant).

