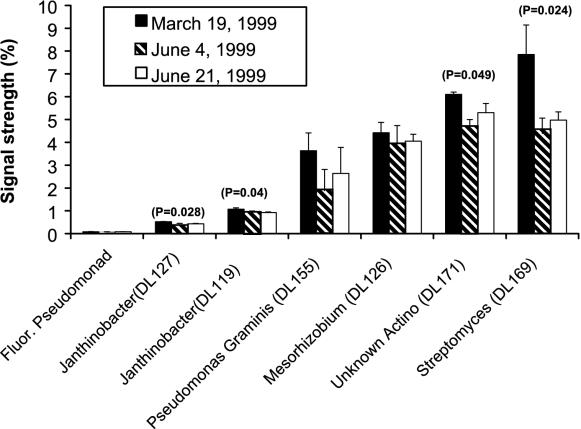
FIG. 10.
Seasonal abundance of selected bacterial isolates based on dot blotting experiments. Values are hybridization signals standardized with known quantities of genomic DNA. The P value is given where the hybridization signal changed significantly over time, based on linear regression analysis. Fluor., fluorescent; Actino, Actinobacteria.

