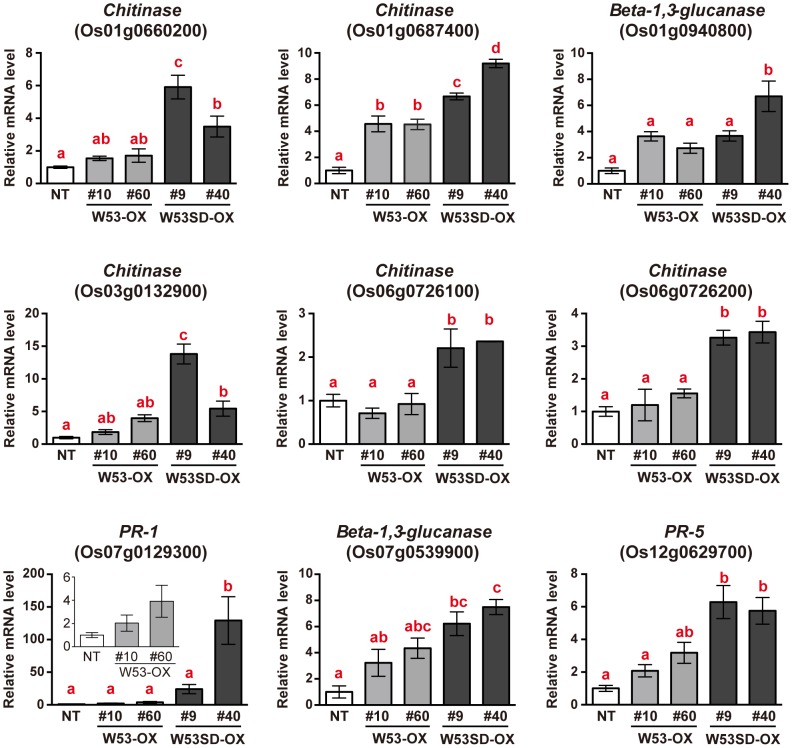
Figure 5. Expression analysis of defense-related genes belonging to group I upregulated genes in W53SD-OX rice plants.
qRT-PCR analysis was performed using total RNA isolated from uninfected rice leaves. Values indicate relative mRNA levels normalized to the expression of the UBQ gene (n = 3); bars indicate the standard error of the mean. Three independent experiments were performed, and a representative result is shown. Statistically different data groups are indicated using different letters (p<0.05 by One-way ANOVA with Tukey post hoc test). NT, non-transformed control; OX, OsWRKY53-overexpressing rice plants; SD-OX; OsWRKY53SD-overexpressing rice plants.

